Romanian vs Immigrants from Western Asia Married-Couple Family Poverty
COMPARE
Romanian
Immigrants from Western Asia
Married-Couple Family Poverty
Married-Couple Family Poverty Comparison
Romanians
Immigrants from Western Asia
4.8%
MARRIED-COUPLE FAMILY POVERTY
92.5/ 100
METRIC RATING
124th/ 347
METRIC RANK
6.0%
MARRIED-COUPLE FAMILY POVERTY
0.7/ 100
METRIC RATING
252nd/ 347
METRIC RANK
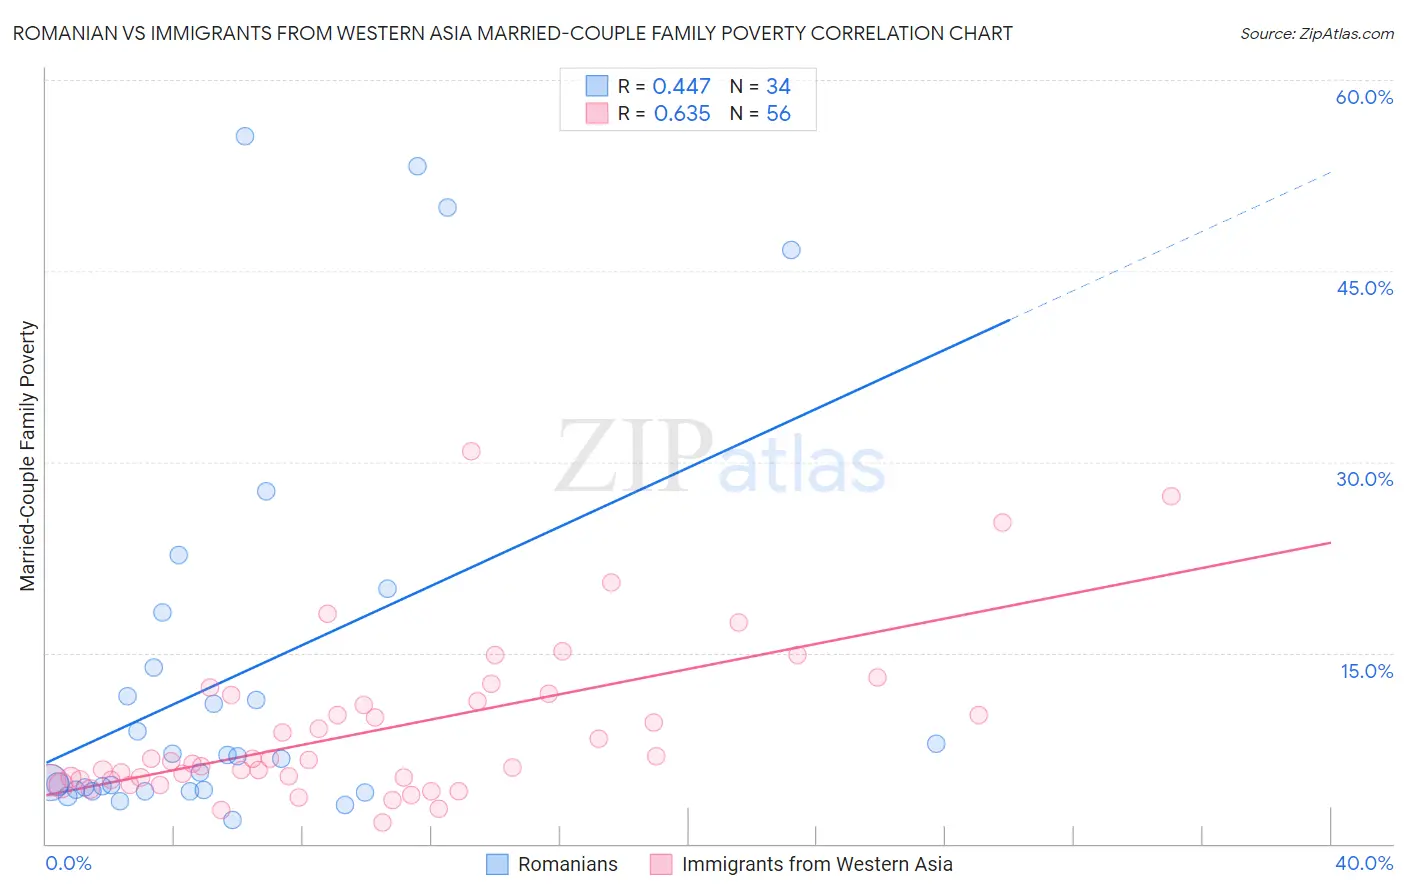
Romanian vs Immigrants from Western Asia Married-Couple Family Poverty Correlation Chart
The statistical analysis conducted on geographies consisting of 374,441,854 people shows a moderate positive correlation between the proportion of Romanians and poverty level among married-couple families in the United States with a correlation coefficient (R) of 0.447 and weighted average of 4.8%. Similarly, the statistical analysis conducted on geographies consisting of 400,576,171 people shows a significant positive correlation between the proportion of Immigrants from Western Asia and poverty level among married-couple families in the United States with a correlation coefficient (R) of 0.635 and weighted average of 6.0%, a difference of 23.2%.
Married-Couple Family Poverty Correlation Summary
| Measurement | Romanian | Immigrants from Western Asia |
| Minimum | 1.9% | 1.7% |
| Maximum | 55.6% | 30.8% |
| Range | 53.6% | 29.2% |
| Mean | 13.3% | 8.9% |
| Median | 6.8% | 6.5% |
| Interquartile 25% (IQ1) | 4.2% | 5.0% |
| Interquartile 75% (IQ3) | 13.9% | 11.5% |
| Interquartile Range (IQR) | 9.6% | 6.5% |
| Standard Deviation (Sample) | 15.4% | 6.2% |
| Standard Deviation (Population) | 15.1% | 6.1% |
Similar Demographics by Married-Couple Family Poverty
Demographics Similar to Romanians by Married-Couple Family Poverty
In terms of married-couple family poverty, the demographic groups most similar to Romanians are Immigrants from Bosnia and Herzegovina (4.8%, a difference of 0.020%), Immigrants from Asia (4.8%, a difference of 0.090%), Egyptian (4.8%, a difference of 0.23%), Jordanian (4.8%, a difference of 0.27%), and White/Caucasian (4.8%, a difference of 0.29%).
| Demographics | Rating | Rank | Married-Couple Family Poverty |
| Kenyans | 94.7 /100 | #117 | Exceptional 4.8% |
| Immigrants | Philippines | 94.6 /100 | #118 | Exceptional 4.8% |
| Immigrants | Eastern Asia | 94.0 /100 | #119 | Exceptional 4.8% |
| Immigrants | Southern Europe | 93.4 /100 | #120 | Exceptional 4.8% |
| Indians (Asian) | 93.2 /100 | #121 | Exceptional 4.8% |
| Whites/Caucasians | 93.1 /100 | #122 | Exceptional 4.8% |
| Jordanians | 93.1 /100 | #123 | Exceptional 4.8% |
| Romanians | 92.5 /100 | #124 | Exceptional 4.8% |
| Immigrants | Bosnia and Herzegovina | 92.5 /100 | #125 | Exceptional 4.8% |
| Immigrants | Asia | 92.3 /100 | #126 | Exceptional 4.8% |
| Egyptians | 92.0 /100 | #127 | Exceptional 4.8% |
| Palestinians | 91.2 /100 | #128 | Exceptional 4.9% |
| Immigrants | Pakistan | 90.7 /100 | #129 | Exceptional 4.9% |
| Soviet Union | 90.7 /100 | #130 | Exceptional 4.9% |
| Immigrants | Eastern Europe | 90.5 /100 | #131 | Exceptional 4.9% |
Demographics Similar to Immigrants from Western Asia by Married-Couple Family Poverty
In terms of married-couple family poverty, the demographic groups most similar to Immigrants from Western Asia are African (6.0%, a difference of 0.090%), Immigrants from Somalia (6.0%, a difference of 0.15%), Comanche (6.0%, a difference of 0.30%), Immigrants from Ghana (5.9%, a difference of 0.64%), and Bangladeshi (6.0%, a difference of 0.80%).
| Demographics | Rating | Rank | Married-Couple Family Poverty |
| Immigrants | Afghanistan | 2.1 /100 | #245 | Tragic 5.8% |
| Immigrants | Venezuela | 1.8 /100 | #246 | Tragic 5.8% |
| Iraqis | 1.4 /100 | #247 | Tragic 5.9% |
| Cree | 1.2 /100 | #248 | Tragic 5.9% |
| Tsimshian | 1.1 /100 | #249 | Tragic 5.9% |
| Immigrants | Eritrea | 1.1 /100 | #250 | Tragic 5.9% |
| Immigrants | Ghana | 1.0 /100 | #251 | Tragic 5.9% |
| Immigrants | Western Asia | 0.7 /100 | #252 | Tragic 6.0% |
| Africans | 0.7 /100 | #253 | Tragic 6.0% |
| Immigrants | Somalia | 0.7 /100 | #254 | Tragic 6.0% |
| Comanche | 0.7 /100 | #255 | Tragic 6.0% |
| Bangladeshis | 0.5 /100 | #256 | Tragic 6.0% |
| Immigrants | Burma/Myanmar | 0.5 /100 | #257 | Tragic 6.0% |
| Immigrants | Immigrants | 0.5 /100 | #258 | Tragic 6.0% |
| Alaskan Athabascans | 0.4 /100 | #259 | Tragic 6.1% |