Romanian vs Immigrants from Belize Single Mother Households
COMPARE
Romanian
Immigrants from Belize
Single Mother Households
Single Mother Households Comparison
Romanians
Immigrants from Belize
5.6%
SINGLE MOTHER HOUSEHOLDS
98.1/ 100
METRIC RATING
77th/ 347
METRIC RANK
7.7%
SINGLE MOTHER HOUSEHOLDS
0.0/ 100
METRIC RATING
284th/ 347
METRIC RANK
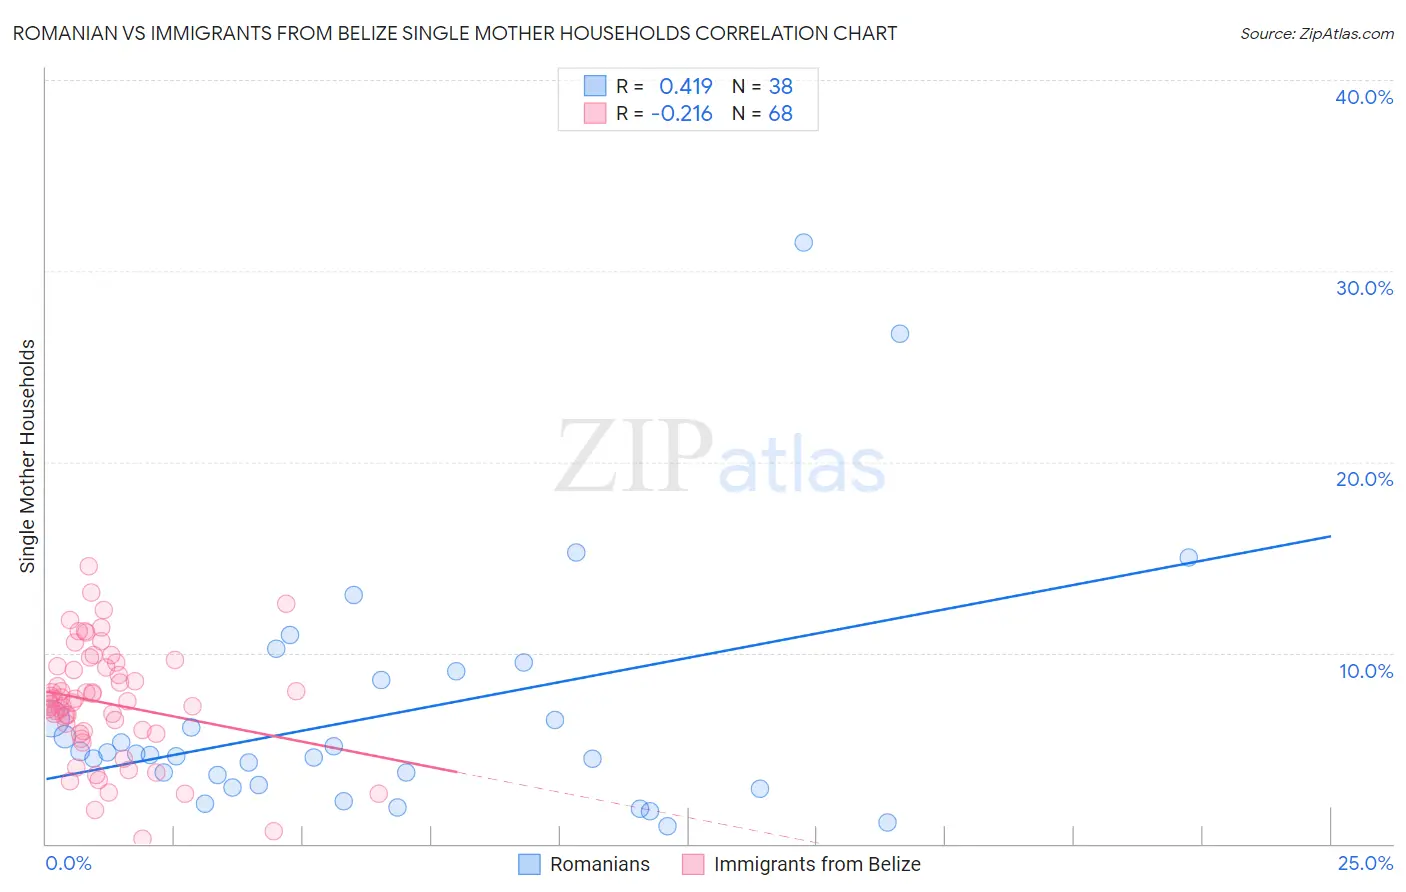
Romanian vs Immigrants from Belize Single Mother Households Correlation Chart
The statistical analysis conducted on geographies consisting of 376,701,269 people shows a moderate positive correlation between the proportion of Romanians and percentage of single mother households in the United States with a correlation coefficient (R) of 0.419 and weighted average of 5.6%. Similarly, the statistical analysis conducted on geographies consisting of 130,177,465 people shows a weak negative correlation between the proportion of Immigrants from Belize and percentage of single mother households in the United States with a correlation coefficient (R) of -0.216 and weighted average of 7.7%, a difference of 37.0%.
Single Mother Households Correlation Summary
| Measurement | Romanian | Immigrants from Belize |
| Minimum | 0.92% | 0.26% |
| Maximum | 31.5% | 14.5% |
| Range | 30.6% | 14.2% |
| Mean | 6.8% | 7.4% |
| Median | 4.7% | 7.4% |
| Interquartile 25% (IQ1) | 3.0% | 5.8% |
| Interquartile 75% (IQ3) | 8.6% | 9.3% |
| Interquartile Range (IQR) | 5.6% | 3.4% |
| Standard Deviation (Sample) | 6.5% | 3.0% |
| Standard Deviation (Population) | 6.4% | 2.9% |
Similar Demographics by Single Mother Households
Demographics Similar to Romanians by Single Mother Households
In terms of single mother households, the demographic groups most similar to Romanians are Swiss (5.6%, a difference of 0.0%), New Zealander (5.6%, a difference of 0.19%), Immigrants from Sri Lanka (5.6%, a difference of 0.21%), Slovene (5.6%, a difference of 0.25%), and Czech (5.6%, a difference of 0.31%).
| Demographics | Rating | Rank | Single Mother Households |
| Immigrants | Eastern Europe | 98.4 /100 | #70 | Exceptional 5.6% |
| Immigrants | Kazakhstan | 98.4 /100 | #71 | Exceptional 5.6% |
| Immigrants | Netherlands | 98.4 /100 | #72 | Exceptional 5.6% |
| Immigrants | Asia | 98.4 /100 | #73 | Exceptional 5.6% |
| Immigrants | North America | 98.3 /100 | #74 | Exceptional 5.6% |
| Slovenes | 98.3 /100 | #75 | Exceptional 5.6% |
| New Zealanders | 98.2 /100 | #76 | Exceptional 5.6% |
| Romanians | 98.1 /100 | #77 | Exceptional 5.6% |
| Swiss | 98.1 /100 | #78 | Exceptional 5.6% |
| Immigrants | Sri Lanka | 98.0 /100 | #79 | Exceptional 5.6% |
| Czechs | 97.9 /100 | #80 | Exceptional 5.6% |
| Immigrants | Moldova | 97.9 /100 | #81 | Exceptional 5.6% |
| Immigrants | Malaysia | 97.8 /100 | #82 | Exceptional 5.7% |
| Immigrants | Hungary | 97.8 /100 | #83 | Exceptional 5.7% |
| Carpatho Rusyns | 97.7 /100 | #84 | Exceptional 5.7% |
Demographics Similar to Immigrants from Belize by Single Mother Households
In terms of single mother households, the demographic groups most similar to Immigrants from Belize are Trinidadian and Tobagonian (7.7%, a difference of 0.030%), Immigrants from Middle Africa (7.7%, a difference of 0.14%), Immigrants from Guatemala (7.7%, a difference of 0.24%), Sierra Leonean (7.7%, a difference of 0.29%), and Nigerian (7.7%, a difference of 0.60%).
| Demographics | Rating | Rank | Single Mother Households |
| Immigrants | Trinidad and Tobago | 0.1 /100 | #277 | Tragic 7.6% |
| Central Americans | 0.1 /100 | #278 | Tragic 7.6% |
| Immigrants | El Salvador | 0.0 /100 | #279 | Tragic 7.6% |
| Immigrants | Sierra Leone | 0.0 /100 | #280 | Tragic 7.7% |
| Immigrants | Laos | 0.0 /100 | #281 | Tragic 7.7% |
| Guatemalans | 0.0 /100 | #282 | Tragic 7.7% |
| Nigerians | 0.0 /100 | #283 | Tragic 7.7% |
| Immigrants | Belize | 0.0 /100 | #284 | Tragic 7.7% |
| Trinidadians and Tobagonians | 0.0 /100 | #285 | Tragic 7.7% |
| Immigrants | Middle Africa | 0.0 /100 | #286 | Tragic 7.7% |
| Immigrants | Guatemala | 0.0 /100 | #287 | Tragic 7.7% |
| Sierra Leoneans | 0.0 /100 | #288 | Tragic 7.7% |
| Sub-Saharan Africans | 0.0 /100 | #289 | Tragic 7.8% |
| Immigrants | Nigeria | 0.0 /100 | #290 | Tragic 7.8% |
| West Indians | 0.0 /100 | #291 | Tragic 7.8% |