Puget Sound Salish vs Uruguayan Single Female Poverty
COMPARE
Puget Sound Salish
Uruguayan
Single Female Poverty
Single Female Poverty Comparison
Puget Sound Salish
Uruguayans
20.6%
SINGLE FEMALE POVERTY
79.6/ 100
METRIC RATING
151st/ 347
METRIC RANK
20.2%
SINGLE FEMALE POVERTY
92.1/ 100
METRIC RATING
132nd/ 347
METRIC RANK
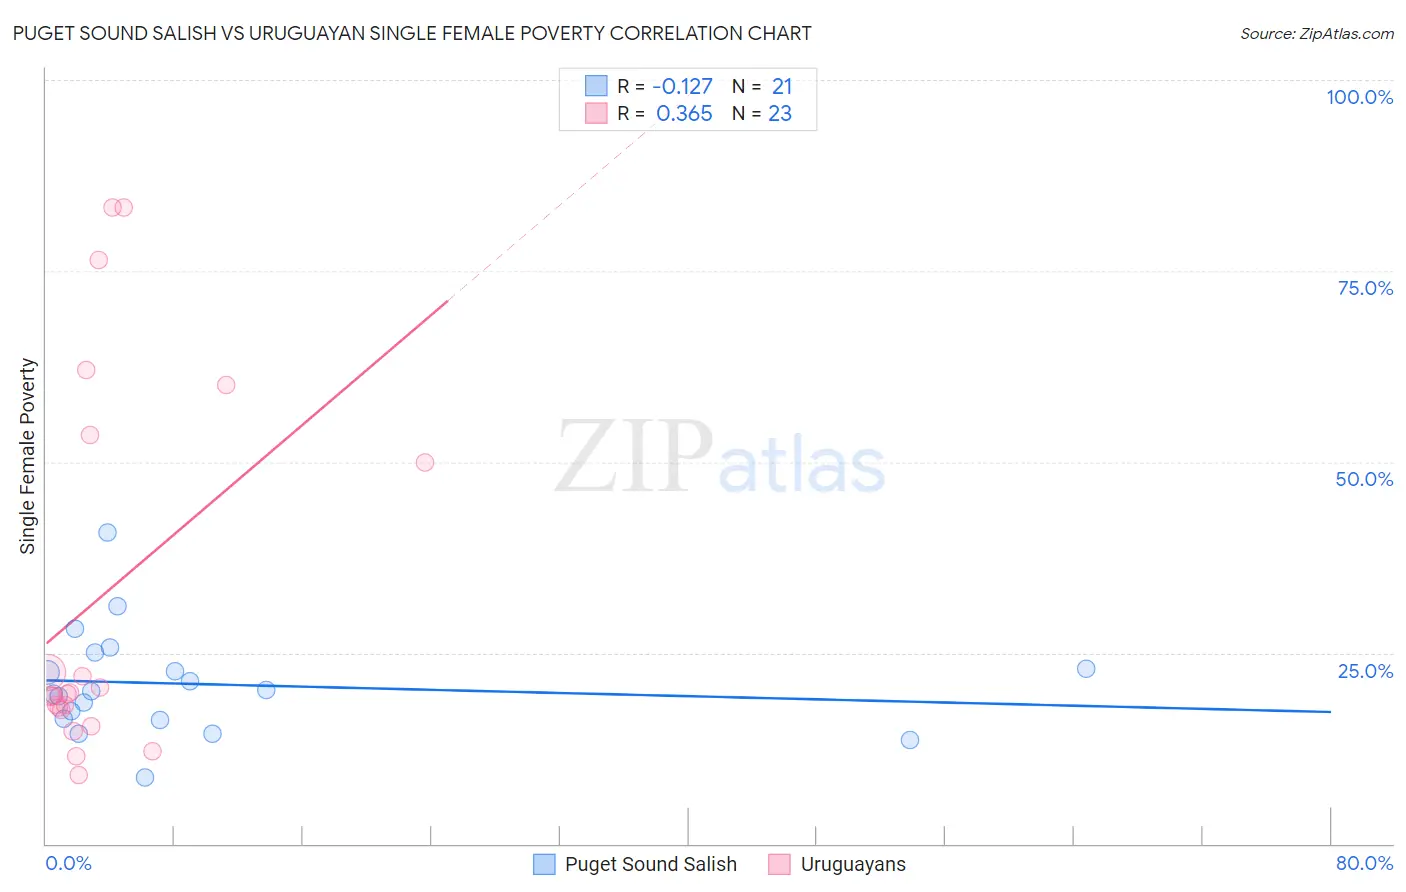
Puget Sound Salish vs Uruguayan Single Female Poverty Correlation Chart
The statistical analysis conducted on geographies consisting of 45,841,624 people shows a poor negative correlation between the proportion of Puget Sound Salish and poverty level among single females in the United States with a correlation coefficient (R) of -0.127 and weighted average of 20.6%. Similarly, the statistical analysis conducted on geographies consisting of 143,837,387 people shows a mild positive correlation between the proportion of Uruguayans and poverty level among single females in the United States with a correlation coefficient (R) of 0.365 and weighted average of 20.2%, a difference of 1.8%.
Single Female Poverty Correlation Summary
| Measurement | Puget Sound Salish | Uruguayan |
| Minimum | 8.6% | 9.0% |
| Maximum | 40.8% | 83.3% |
| Range | 32.2% | 74.3% |
| Mean | 20.9% | 32.4% |
| Median | 20.0% | 19.7% |
| Interquartile 25% (IQ1) | 16.4% | 17.5% |
| Interquartile 75% (IQ3) | 24.0% | 53.6% |
| Interquartile Range (IQR) | 7.6% | 36.1% |
| Standard Deviation (Sample) | 6.9% | 24.7% |
| Standard Deviation (Population) | 6.8% | 24.1% |
Demographics Similar to Puget Sound Salish and Uruguayans by Single Female Poverty
In terms of single female poverty, the demographic groups most similar to Puget Sound Salish are Immigrants from Denmark (20.5%, a difference of 0.090%), Portuguese (20.5%, a difference of 0.19%), Luxembourger (20.4%, a difference of 0.58%), South African (20.4%, a difference of 0.63%), and Venezuelan (20.4%, a difference of 0.66%). Similarly, the demographic groups most similar to Uruguayans are Pakistani (20.2%, a difference of 0.0%), Immigrants from England (20.2%, a difference of 0.030%), Immigrants from Venezuela (20.2%, a difference of 0.12%), Immigrants from Iraq (20.2%, a difference of 0.18%), and Immigrants from Canada (20.2%, a difference of 0.18%).
| Demographics | Rating | Rank | Single Female Poverty |
| Pakistanis | 92.1 /100 | #131 | Exceptional 20.2% |
| Uruguayans | 92.1 /100 | #132 | Exceptional 20.2% |
| Immigrants | England | 91.9 /100 | #133 | Exceptional 20.2% |
| Immigrants | Venezuela | 91.5 /100 | #134 | Exceptional 20.2% |
| Immigrants | Iraq | 91.2 /100 | #135 | Exceptional 20.2% |
| Immigrants | Canada | 91.2 /100 | #136 | Exceptional 20.2% |
| Immigrants | Nepal | 90.6 /100 | #137 | Exceptional 20.3% |
| Slovenes | 90.5 /100 | #138 | Exceptional 20.3% |
| Immigrants | Kuwait | 90.4 /100 | #139 | Exceptional 20.3% |
| Syrians | 90.4 /100 | #140 | Exceptional 20.3% |
| Immigrants | North America | 89.5 /100 | #141 | Excellent 20.3% |
| Immigrants | Uganda | 89.1 /100 | #142 | Excellent 20.3% |
| Australians | 88.4 /100 | #143 | Excellent 20.3% |
| Immigrants | Uzbekistan | 88.3 /100 | #144 | Excellent 20.3% |
| Austrians | 85.8 /100 | #145 | Excellent 20.4% |
| Venezuelans | 85.5 /100 | #146 | Excellent 20.4% |
| South Africans | 85.3 /100 | #147 | Excellent 20.4% |
| Luxembourgers | 84.9 /100 | #148 | Excellent 20.4% |
| Portuguese | 81.5 /100 | #149 | Excellent 20.5% |
| Immigrants | Denmark | 80.5 /100 | #150 | Excellent 20.5% |
| Puget Sound Salish | 79.6 /100 | #151 | Good 20.6% |