Ethiopian vs Uruguayan Single Female Poverty
COMPARE
Ethiopian
Uruguayan
Single Female Poverty
Single Female Poverty Comparison
Ethiopians
Uruguayans
19.9%
SINGLE FEMALE POVERTY
96.7/ 100
METRIC RATING
106th/ 347
METRIC RANK
20.2%
SINGLE FEMALE POVERTY
92.1/ 100
METRIC RATING
132nd/ 347
METRIC RANK
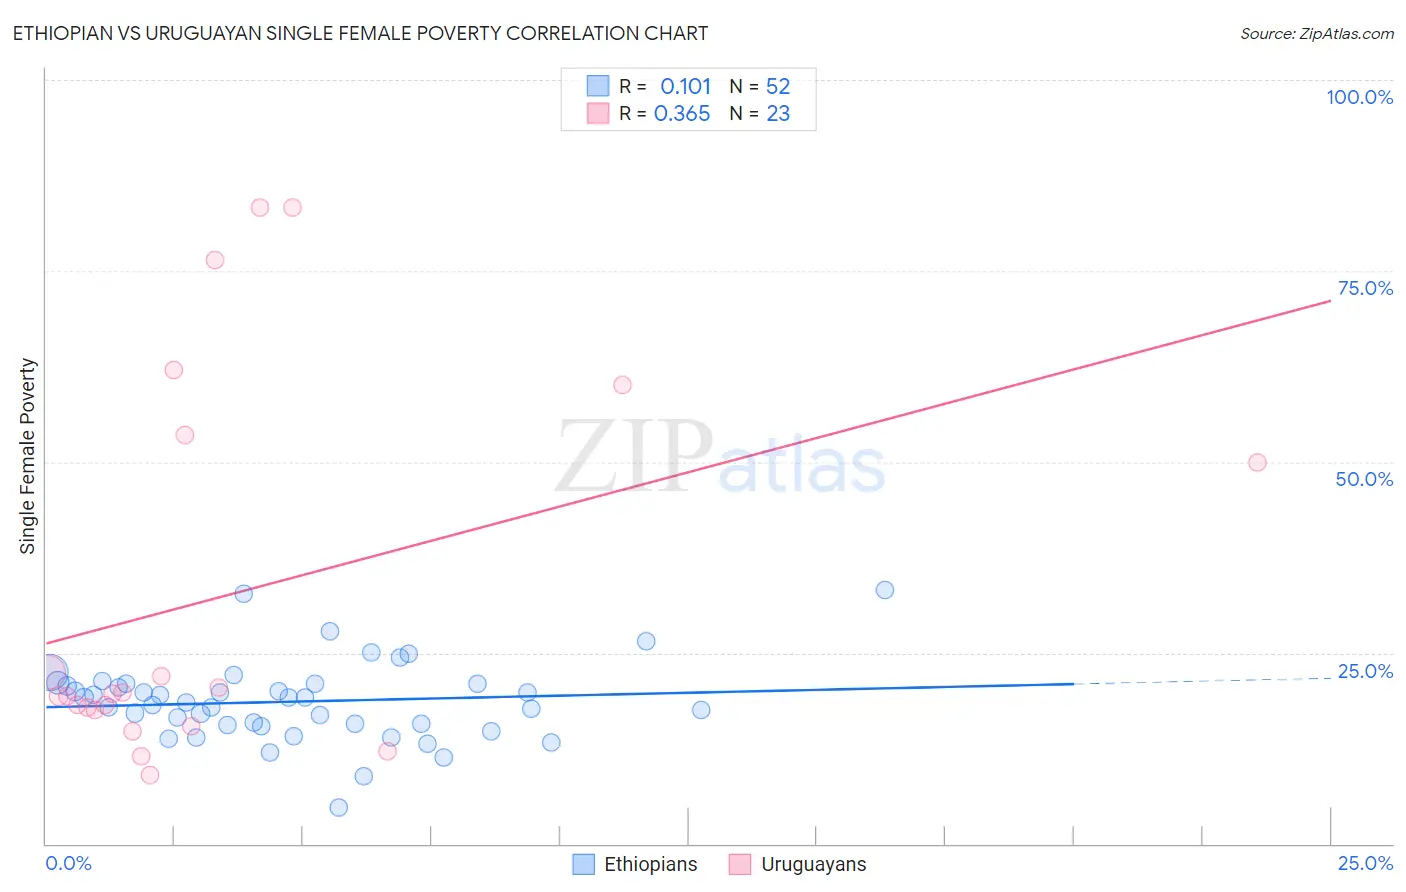
Ethiopian vs Uruguayan Single Female Poverty Correlation Chart
The statistical analysis conducted on geographies consisting of 221,686,273 people shows a poor positive correlation between the proportion of Ethiopians and poverty level among single females in the United States with a correlation coefficient (R) of 0.101 and weighted average of 19.9%. Similarly, the statistical analysis conducted on geographies consisting of 143,837,387 people shows a mild positive correlation between the proportion of Uruguayans and poverty level among single females in the United States with a correlation coefficient (R) of 0.365 and weighted average of 20.2%, a difference of 1.5%.
Single Female Poverty Correlation Summary
| Measurement | Ethiopian | Uruguayan |
| Minimum | 4.8% | 9.0% |
| Maximum | 33.2% | 83.3% |
| Range | 28.4% | 74.3% |
| Mean | 18.6% | 32.4% |
| Median | 18.8% | 19.7% |
| Interquartile 25% (IQ1) | 15.6% | 17.5% |
| Interquartile 75% (IQ3) | 20.9% | 53.6% |
| Interquartile Range (IQR) | 5.3% | 36.1% |
| Standard Deviation (Sample) | 5.2% | 24.7% |
| Standard Deviation (Population) | 5.1% | 24.1% |
Similar Demographics by Single Female Poverty
Demographics Similar to Ethiopians by Single Female Poverty
In terms of single female poverty, the demographic groups most similar to Ethiopians are Immigrants from Syria (19.9%, a difference of 0.020%), Native Hawaiian (19.9%, a difference of 0.070%), Colombian (19.9%, a difference of 0.070%), Immigrants from Western Asia (19.9%, a difference of 0.080%), and Israeli (19.9%, a difference of 0.090%).
| Demographics | Rating | Rank | Single Female Poverty |
| Sierra Leoneans | 97.9 /100 | #99 | Exceptional 19.7% |
| Ukrainians | 97.6 /100 | #100 | Exceptional 19.8% |
| Immigrants | Belgium | 97.3 /100 | #101 | Exceptional 19.8% |
| Immigrants | Cameroon | 97.3 /100 | #102 | Exceptional 19.8% |
| Immigrants | Southern Europe | 97.1 /100 | #103 | Exceptional 19.9% |
| Chileans | 96.9 /100 | #104 | Exceptional 19.9% |
| Israelis | 96.9 /100 | #105 | Exceptional 19.9% |
| Ethiopians | 96.7 /100 | #106 | Exceptional 19.9% |
| Immigrants | Syria | 96.7 /100 | #107 | Exceptional 19.9% |
| Native Hawaiians | 96.6 /100 | #108 | Exceptional 19.9% |
| Colombians | 96.6 /100 | #109 | Exceptional 19.9% |
| Immigrants | Western Asia | 96.5 /100 | #110 | Exceptional 19.9% |
| Carpatho Rusyns | 96.1 /100 | #111 | Exceptional 20.0% |
| Immigrants | Netherlands | 96.0 /100 | #112 | Exceptional 20.0% |
| Immigrants | Zimbabwe | 95.9 /100 | #113 | Exceptional 20.0% |
Demographics Similar to Uruguayans by Single Female Poverty
In terms of single female poverty, the demographic groups most similar to Uruguayans are Pakistani (20.2%, a difference of 0.0%), Immigrants from England (20.2%, a difference of 0.030%), Immigrants from Hungary (20.2%, a difference of 0.050%), Immigrants from Morocco (20.2%, a difference of 0.080%), and Immigrants from Venezuela (20.2%, a difference of 0.12%).
| Demographics | Rating | Rank | Single Female Poverty |
| Immigrants | South Africa | 93.9 /100 | #125 | Exceptional 20.1% |
| Serbians | 93.3 /100 | #126 | Exceptional 20.1% |
| Mongolians | 93.2 /100 | #127 | Exceptional 20.2% |
| Immigrants | Spain | 92.7 /100 | #128 | Exceptional 20.2% |
| Immigrants | Morocco | 92.4 /100 | #129 | Exceptional 20.2% |
| Immigrants | Hungary | 92.3 /100 | #130 | Exceptional 20.2% |
| Pakistanis | 92.1 /100 | #131 | Exceptional 20.2% |
| Uruguayans | 92.1 /100 | #132 | Exceptional 20.2% |
| Immigrants | England | 91.9 /100 | #133 | Exceptional 20.2% |
| Immigrants | Venezuela | 91.5 /100 | #134 | Exceptional 20.2% |
| Immigrants | Iraq | 91.2 /100 | #135 | Exceptional 20.2% |
| Immigrants | Canada | 91.2 /100 | #136 | Exceptional 20.2% |
| Immigrants | Nepal | 90.6 /100 | #137 | Exceptional 20.3% |
| Slovenes | 90.5 /100 | #138 | Exceptional 20.3% |
| Immigrants | Kuwait | 90.4 /100 | #139 | Exceptional 20.3% |