Puget Sound Salish vs Uruguayan Unemployment
COMPARE
Puget Sound Salish
Uruguayan
Unemployment
Unemployment Comparison
Puget Sound Salish
Uruguayans
5.2%
UNEMPLOYMENT
56.6/ 100
METRIC RATING
171st/ 347
METRIC RANK
5.2%
UNEMPLOYMENT
60.2/ 100
METRIC RATING
168th/ 347
METRIC RANK
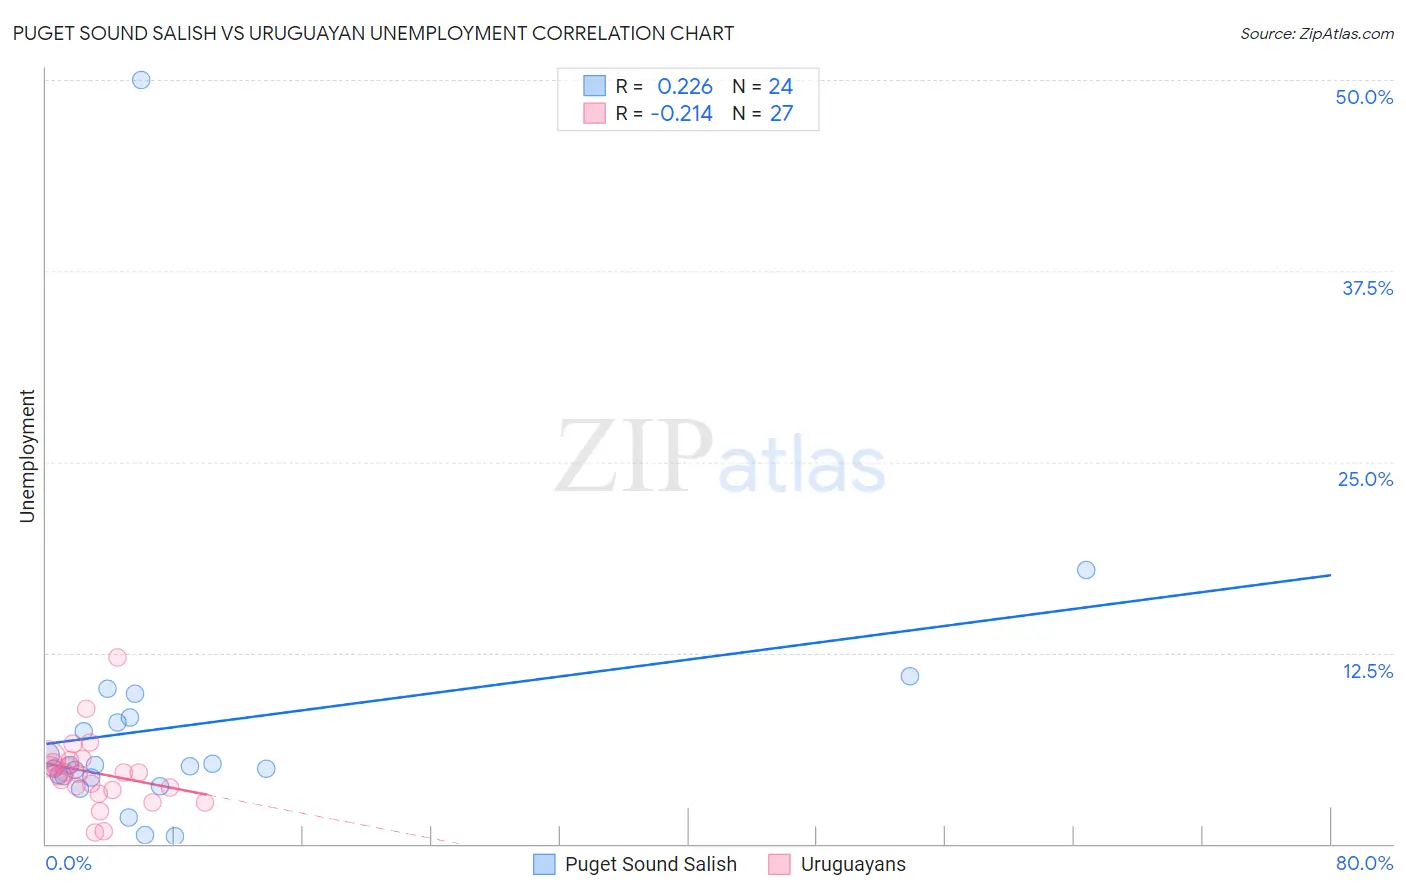
Puget Sound Salish vs Uruguayan Unemployment Correlation Chart
The statistical analysis conducted on geographies consisting of 46,125,873 people shows a weak positive correlation between the proportion of Puget Sound Salish and unemployment in the United States with a correlation coefficient (R) of 0.226 and weighted average of 5.2%. Similarly, the statistical analysis conducted on geographies consisting of 144,766,255 people shows a weak negative correlation between the proportion of Uruguayans and unemployment in the United States with a correlation coefficient (R) of -0.214 and weighted average of 5.2%, a difference of 0.23%.
Unemployment Correlation Summary
| Measurement | Puget Sound Salish | Uruguayan |
| Minimum | 0.50% | 0.70% |
| Maximum | 50.0% | 12.2% |
| Range | 49.5% | 11.5% |
| Mean | 7.8% | 4.7% |
| Median | 5.1% | 4.7% |
| Interquartile 25% (IQ1) | 4.4% | 3.5% |
| Interquartile 75% (IQ3) | 8.1% | 5.5% |
| Interquartile Range (IQR) | 3.7% | 2.0% |
| Standard Deviation (Sample) | 9.7% | 2.3% |
| Standard Deviation (Population) | 9.5% | 2.2% |
Demographics Similar to Puget Sound Salish and Uruguayans by Unemployment
In terms of unemployment, the demographic groups most similar to Puget Sound Salish are Immigrants from Nicaragua (5.2%, a difference of 0.040%), Immigrants from Morocco (5.2%, a difference of 0.16%), Immigrants from Vietnam (5.2%, a difference of 0.25%), Immigrants from Indonesia (5.2%, a difference of 0.29%), and Colombian (5.2%, a difference of 0.29%). Similarly, the demographic groups most similar to Uruguayans are Immigrants from Indonesia (5.2%, a difference of 0.060%), Colombian (5.2%, a difference of 0.060%), Immigrants from Morocco (5.2%, a difference of 0.070%), Immigrants from Brazil (5.2%, a difference of 0.19%), and Immigrants from Nicaragua (5.2%, a difference of 0.19%).
| Demographics | Rating | Rank | Unemployment |
| Immigrants | Russia | 66.6 /100 | #159 | Good 5.2% |
| Laotians | 66.3 /100 | #160 | Good 5.2% |
| Immigrants | Oceania | 65.2 /100 | #161 | Good 5.2% |
| Spanish | 65.1 /100 | #162 | Good 5.2% |
| Immigrants | Zaire | 64.7 /100 | #163 | Good 5.2% |
| Immigrants | Colombia | 64.7 /100 | #164 | Good 5.2% |
| Immigrants | Brazil | 63.1 /100 | #165 | Good 5.2% |
| Immigrants | Indonesia | 61.2 /100 | #166 | Good 5.2% |
| Colombians | 61.1 /100 | #167 | Good 5.2% |
| Uruguayans | 60.2 /100 | #168 | Good 5.2% |
| Immigrants | Morocco | 59.1 /100 | #169 | Average 5.2% |
| Immigrants | Nicaragua | 57.1 /100 | #170 | Average 5.2% |
| Puget Sound Salish | 56.6 /100 | #171 | Average 5.2% |
| Immigrants | Vietnam | 52.5 /100 | #172 | Average 5.2% |
| Immigrants | Poland | 51.8 /100 | #173 | Average 5.3% |
| Immigrants | Congo | 50.0 /100 | #174 | Average 5.3% |
| Taiwanese | 49.6 /100 | #175 | Average 5.3% |
| Nicaraguans | 48.7 /100 | #176 | Average 5.3% |
| Immigrants | Nonimmigrants | 47.9 /100 | #177 | Average 5.3% |
| Afghans | 47.4 /100 | #178 | Average 5.3% |
| Malaysians | 46.8 /100 | #179 | Average 5.3% |