Immigrants from Sudan vs Uruguayan Single Female Poverty
COMPARE
Immigrants from Sudan
Uruguayan
Single Female Poverty
Single Female Poverty Comparison
Immigrants from Sudan
Uruguayans
22.6%
SINGLE FEMALE POVERTY
0.8/ 100
METRIC RATING
255th/ 347
METRIC RANK
20.2%
SINGLE FEMALE POVERTY
92.1/ 100
METRIC RATING
132nd/ 347
METRIC RANK
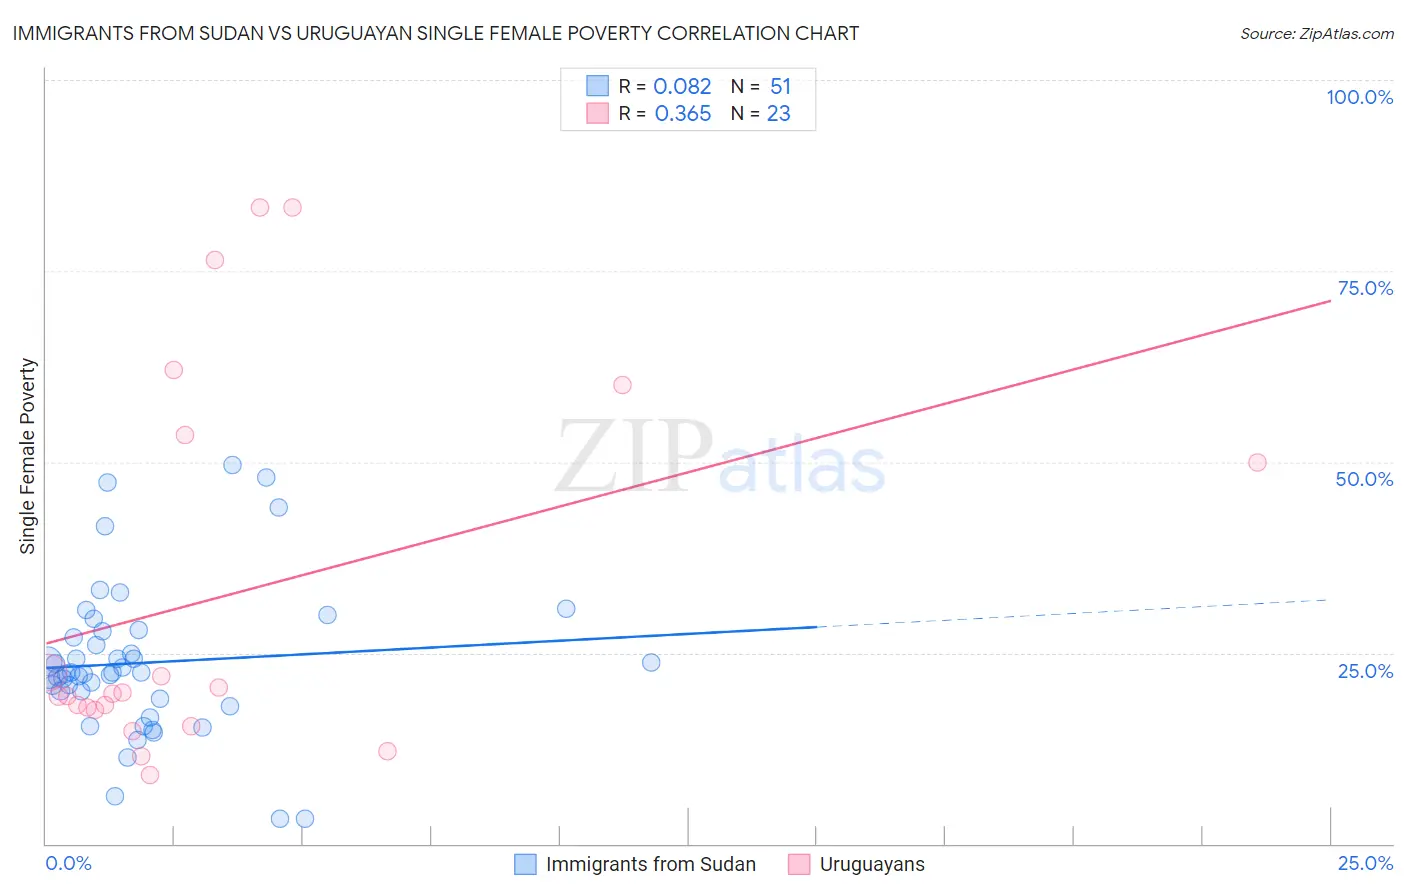
Immigrants from Sudan vs Uruguayan Single Female Poverty Correlation Chart
The statistical analysis conducted on geographies consisting of 118,406,629 people shows a slight positive correlation between the proportion of Immigrants from Sudan and poverty level among single females in the United States with a correlation coefficient (R) of 0.082 and weighted average of 22.6%. Similarly, the statistical analysis conducted on geographies consisting of 143,837,387 people shows a mild positive correlation between the proportion of Uruguayans and poverty level among single females in the United States with a correlation coefficient (R) of 0.365 and weighted average of 20.2%, a difference of 11.7%.
Single Female Poverty Correlation Summary
| Measurement | Immigrants from Sudan | Uruguayan |
| Minimum | 3.2% | 9.0% |
| Maximum | 49.6% | 83.3% |
| Range | 46.4% | 74.3% |
| Mean | 23.7% | 32.4% |
| Median | 22.4% | 19.7% |
| Interquartile 25% (IQ1) | 19.0% | 17.5% |
| Interquartile 75% (IQ3) | 27.8% | 53.6% |
| Interquartile Range (IQR) | 8.8% | 36.1% |
| Standard Deviation (Sample) | 9.9% | 24.7% |
| Standard Deviation (Population) | 9.8% | 24.1% |
Similar Demographics by Single Female Poverty
Demographics Similar to Immigrants from Sudan by Single Female Poverty
In terms of single female poverty, the demographic groups most similar to Immigrants from Sudan are Immigrants from Burma/Myanmar (22.6%, a difference of 0.0%), Immigrants from Liberia (22.5%, a difference of 0.10%), Immigrants from Belize (22.6%, a difference of 0.14%), Delaware (22.5%, a difference of 0.19%), and Sudanese (22.6%, a difference of 0.29%).
| Demographics | Rating | Rank | Single Female Poverty |
| Belizeans | 1.4 /100 | #248 | Tragic 22.4% |
| Immigrants | Caribbean | 1.3 /100 | #249 | Tragic 22.4% |
| Immigrants | Bahamas | 1.2 /100 | #250 | Tragic 22.5% |
| Immigrants | West Indies | 1.0 /100 | #251 | Tragic 22.5% |
| Delaware | 1.0 /100 | #252 | Tragic 22.5% |
| Immigrants | Liberia | 0.9 /100 | #253 | Tragic 22.5% |
| Immigrants | Burma/Myanmar | 0.8 /100 | #254 | Tragic 22.6% |
| Immigrants | Sudan | 0.8 /100 | #255 | Tragic 22.6% |
| Immigrants | Belize | 0.8 /100 | #256 | Tragic 22.6% |
| Sudanese | 0.7 /100 | #257 | Tragic 22.6% |
| Bahamians | 0.6 /100 | #258 | Tragic 22.7% |
| Whites/Caucasians | 0.6 /100 | #259 | Tragic 22.7% |
| Celtics | 0.5 /100 | #260 | Tragic 22.7% |
| Immigrants | Cabo Verde | 0.4 /100 | #261 | Tragic 22.8% |
| British West Indians | 0.4 /100 | #262 | Tragic 22.8% |
Demographics Similar to Uruguayans by Single Female Poverty
In terms of single female poverty, the demographic groups most similar to Uruguayans are Pakistani (20.2%, a difference of 0.0%), Immigrants from England (20.2%, a difference of 0.030%), Immigrants from Hungary (20.2%, a difference of 0.050%), Immigrants from Morocco (20.2%, a difference of 0.080%), and Immigrants from Venezuela (20.2%, a difference of 0.12%).
| Demographics | Rating | Rank | Single Female Poverty |
| Immigrants | South Africa | 93.9 /100 | #125 | Exceptional 20.1% |
| Serbians | 93.3 /100 | #126 | Exceptional 20.1% |
| Mongolians | 93.2 /100 | #127 | Exceptional 20.2% |
| Immigrants | Spain | 92.7 /100 | #128 | Exceptional 20.2% |
| Immigrants | Morocco | 92.4 /100 | #129 | Exceptional 20.2% |
| Immigrants | Hungary | 92.3 /100 | #130 | Exceptional 20.2% |
| Pakistanis | 92.1 /100 | #131 | Exceptional 20.2% |
| Uruguayans | 92.1 /100 | #132 | Exceptional 20.2% |
| Immigrants | England | 91.9 /100 | #133 | Exceptional 20.2% |
| Immigrants | Venezuela | 91.5 /100 | #134 | Exceptional 20.2% |
| Immigrants | Iraq | 91.2 /100 | #135 | Exceptional 20.2% |
| Immigrants | Canada | 91.2 /100 | #136 | Exceptional 20.2% |
| Immigrants | Nepal | 90.6 /100 | #137 | Exceptional 20.3% |
| Slovenes | 90.5 /100 | #138 | Exceptional 20.3% |
| Immigrants | Kuwait | 90.4 /100 | #139 | Exceptional 20.3% |