Puget Sound Salish vs Uruguayan Male Disability
COMPARE
Puget Sound Salish
Uruguayan
Male Disability
Male Disability Comparison
Puget Sound Salish
Uruguayans
13.5%
MALE DISABILITY
0.0/ 100
METRIC RATING
313th/ 347
METRIC RANK
10.7%
MALE DISABILITY
95.3/ 100
METRIC RATING
103rd/ 347
METRIC RANK
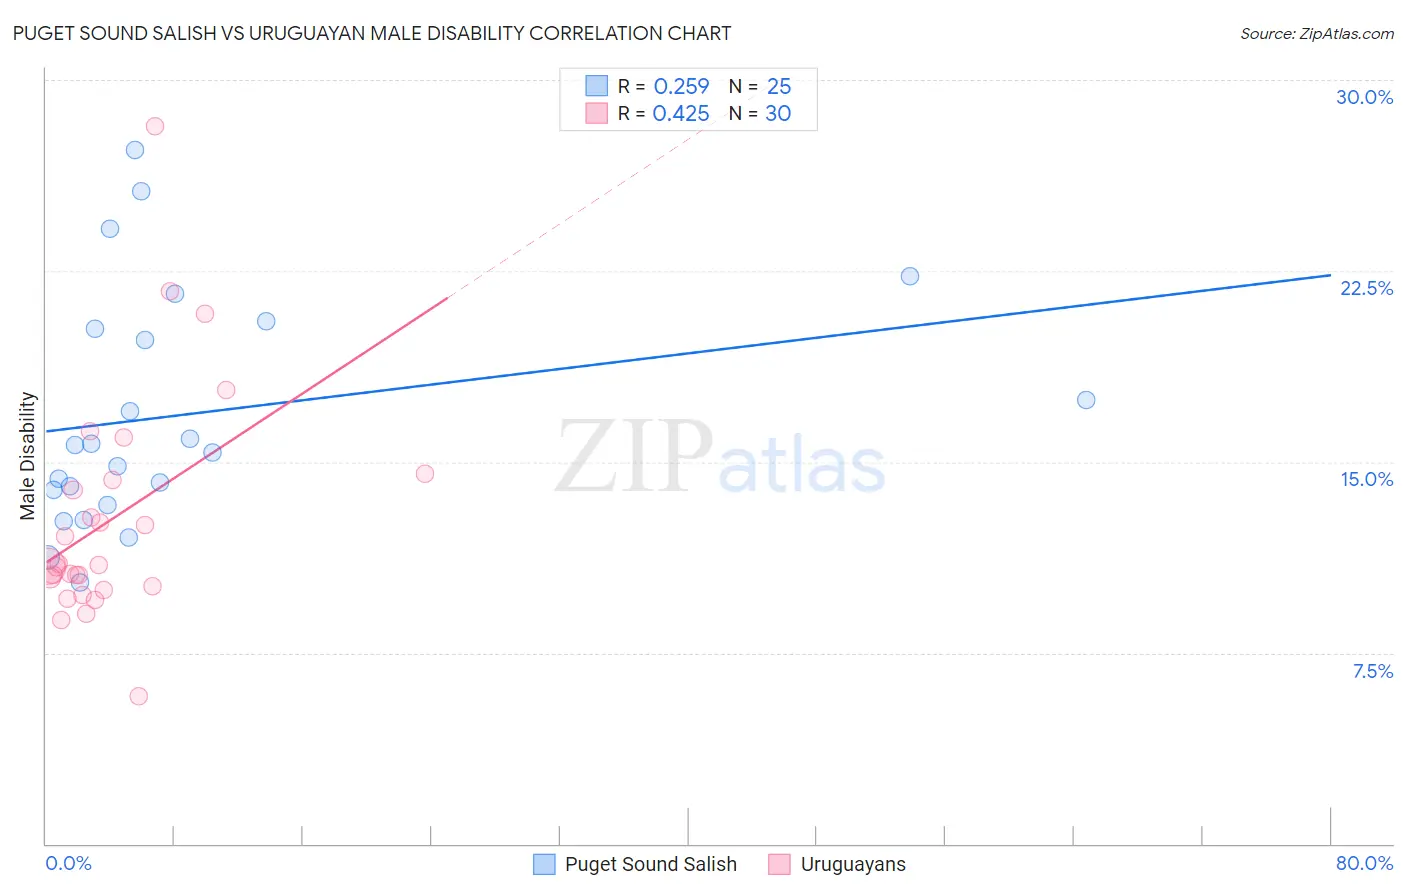
Puget Sound Salish vs Uruguayan Male Disability Correlation Chart
The statistical analysis conducted on geographies consisting of 46,152,398 people shows a weak positive correlation between the proportion of Puget Sound Salish and percentage of males with a disability in the United States with a correlation coefficient (R) of 0.259 and weighted average of 13.5%. Similarly, the statistical analysis conducted on geographies consisting of 144,784,300 people shows a moderate positive correlation between the proportion of Uruguayans and percentage of males with a disability in the United States with a correlation coefficient (R) of 0.425 and weighted average of 10.7%, a difference of 26.0%.
Male Disability Correlation Summary
| Measurement | Puget Sound Salish | Uruguayan |
| Minimum | 10.3% | 5.8% |
| Maximum | 27.3% | 28.2% |
| Range | 17.0% | 22.4% |
| Mean | 16.9% | 12.7% |
| Median | 15.6% | 10.9% |
| Interquartile 25% (IQ1) | 13.6% | 10.1% |
| Interquartile 75% (IQ3) | 20.4% | 14.3% |
| Interquartile Range (IQR) | 6.8% | 4.2% |
| Standard Deviation (Sample) | 4.6% | 4.5% |
| Standard Deviation (Population) | 4.5% | 4.5% |
Similar Demographics by Male Disability
Demographics Similar to Puget Sound Salish by Male Disability
In terms of male disability, the demographic groups most similar to Puget Sound Salish are Yakama (13.5%, a difference of 0.020%), Aleut (13.5%, a difference of 0.060%), Iroquois (13.6%, a difference of 0.22%), Alaska Native (13.6%, a difference of 0.27%), and Delaware (13.5%, a difference of 0.57%).
| Demographics | Rating | Rank | Male Disability |
| Spanish Americans | 0.0 /100 | #306 | Tragic 13.3% |
| Arapaho | 0.0 /100 | #307 | Tragic 13.3% |
| French American Indians | 0.0 /100 | #308 | Tragic 13.4% |
| Blackfeet | 0.0 /100 | #309 | Tragic 13.4% |
| Immigrants | Azores | 0.0 /100 | #310 | Tragic 13.4% |
| Delaware | 0.0 /100 | #311 | Tragic 13.5% |
| Yakama | 0.0 /100 | #312 | Tragic 13.5% |
| Puget Sound Salish | 0.0 /100 | #313 | Tragic 13.5% |
| Aleuts | 0.0 /100 | #314 | Tragic 13.5% |
| Iroquois | 0.0 /100 | #315 | Tragic 13.6% |
| Alaska Natives | 0.0 /100 | #316 | Tragic 13.6% |
| Paiute | 0.0 /100 | #317 | Tragic 13.7% |
| Cree | 0.0 /100 | #318 | Tragic 13.7% |
| Americans | 0.0 /100 | #319 | Tragic 13.8% |
| Tlingit-Haida | 0.0 /100 | #320 | Tragic 13.8% |
Demographics Similar to Uruguayans by Male Disability
In terms of male disability, the demographic groups most similar to Uruguayans are Immigrants from Eastern Europe (10.7%, a difference of 0.010%), Immigrants from Nigeria (10.8%, a difference of 0.060%), Immigrants from Brazil (10.8%, a difference of 0.080%), Immigrants from Greece (10.7%, a difference of 0.11%), and Immigrants from Syria (10.8%, a difference of 0.12%).
| Demographics | Rating | Rank | Male Disability |
| Nicaraguans | 96.6 /100 | #96 | Exceptional 10.7% |
| Immigrants | Armenia | 96.6 /100 | #97 | Exceptional 10.7% |
| Immigrants | Romania | 96.5 /100 | #98 | Exceptional 10.7% |
| Immigrants | Switzerland | 96.1 /100 | #99 | Exceptional 10.7% |
| Immigrants | Kazakhstan | 95.9 /100 | #100 | Exceptional 10.7% |
| Immigrants | Greece | 95.6 /100 | #101 | Exceptional 10.7% |
| Immigrants | Eastern Europe | 95.3 /100 | #102 | Exceptional 10.7% |
| Uruguayans | 95.3 /100 | #103 | Exceptional 10.7% |
| Immigrants | Nigeria | 95.1 /100 | #104 | Exceptional 10.8% |
| Immigrants | Brazil | 95.0 /100 | #105 | Exceptional 10.8% |
| Immigrants | Syria | 94.9 /100 | #106 | Exceptional 10.8% |
| Immigrants | Eastern Africa | 94.3 /100 | #107 | Exceptional 10.8% |
| Immigrants | Belgium | 94.2 /100 | #108 | Exceptional 10.8% |
| Immigrants | Uganda | 94.0 /100 | #109 | Exceptional 10.8% |
| Immigrants | Immigrants | 93.9 /100 | #110 | Exceptional 10.8% |