Immigrants from Jordan vs Uruguayan Single Female Poverty
COMPARE
Immigrants from Jordan
Uruguayan
Single Female Poverty
Single Female Poverty Comparison
Immigrants from Jordan
Uruguayans
19.3%
SINGLE FEMALE POVERTY
99.4/ 100
METRIC RATING
70th/ 347
METRIC RANK
20.2%
SINGLE FEMALE POVERTY
92.1/ 100
METRIC RATING
132nd/ 347
METRIC RANK
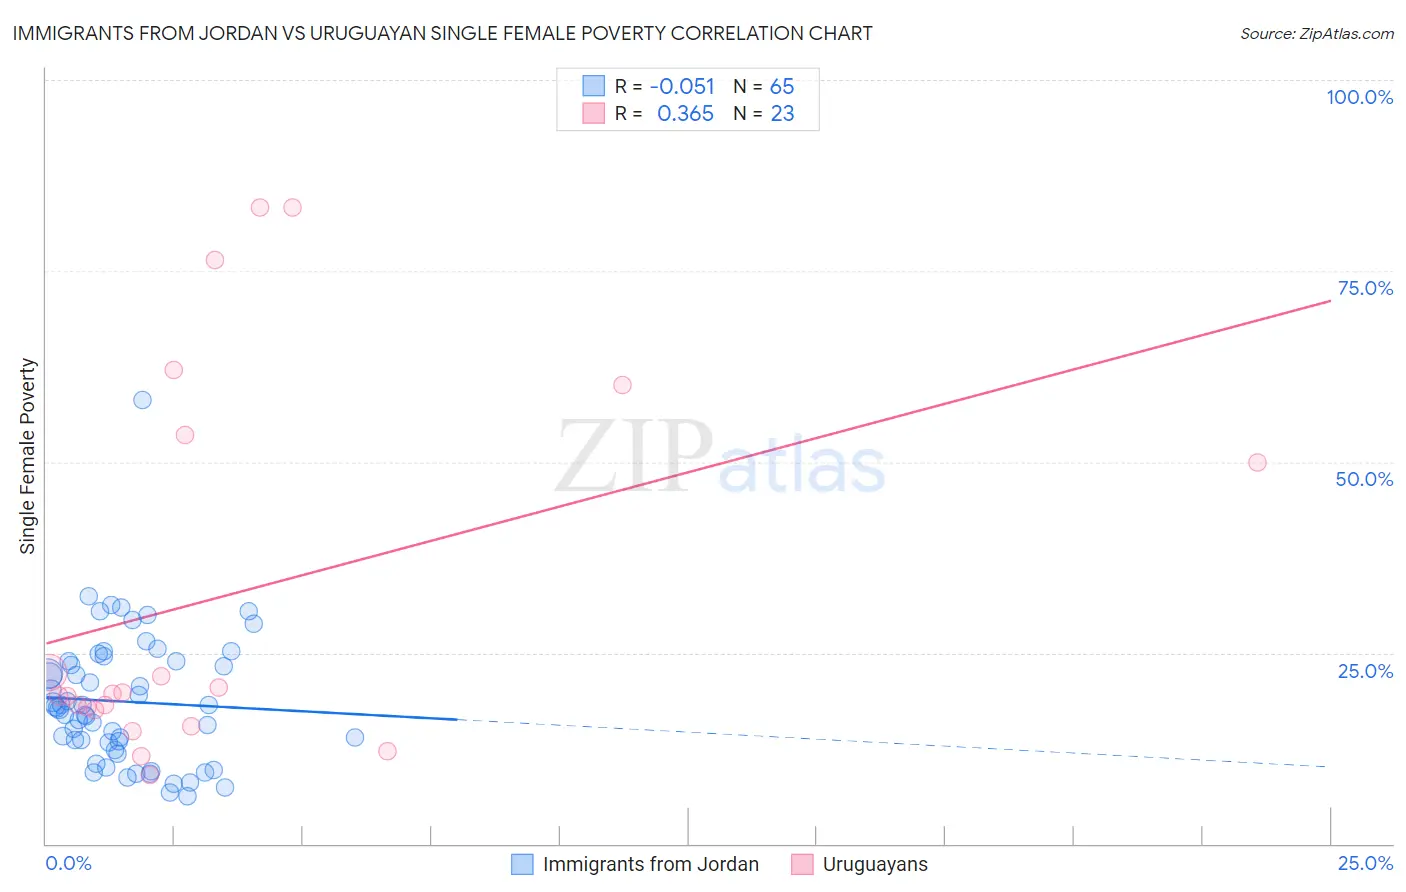
Immigrants from Jordan vs Uruguayan Single Female Poverty Correlation Chart
The statistical analysis conducted on geographies consisting of 180,238,780 people shows a slight negative correlation between the proportion of Immigrants from Jordan and poverty level among single females in the United States with a correlation coefficient (R) of -0.051 and weighted average of 19.3%. Similarly, the statistical analysis conducted on geographies consisting of 143,837,387 people shows a mild positive correlation between the proportion of Uruguayans and poverty level among single females in the United States with a correlation coefficient (R) of 0.365 and weighted average of 20.2%, a difference of 4.6%.
Single Female Poverty Correlation Summary
| Measurement | Immigrants from Jordan | Uruguayan |
| Minimum | 6.2% | 9.0% |
| Maximum | 58.2% | 83.3% |
| Range | 51.9% | 74.3% |
| Mean | 18.6% | 32.4% |
| Median | 17.8% | 19.7% |
| Interquartile 25% (IQ1) | 12.8% | 17.5% |
| Interquartile 75% (IQ3) | 23.9% | 53.6% |
| Interquartile Range (IQR) | 11.1% | 36.1% |
| Standard Deviation (Sample) | 8.7% | 24.7% |
| Standard Deviation (Population) | 8.6% | 24.1% |
Similar Demographics by Single Female Poverty
Demographics Similar to Immigrants from Jordan by Single Female Poverty
In terms of single female poverty, the demographic groups most similar to Immigrants from Jordan are Paraguayan (19.3%, a difference of 0.060%), Immigrants from South Eastern Asia (19.3%, a difference of 0.070%), Immigrants from Latvia (19.3%, a difference of 0.070%), Immigrants from Peru (19.3%, a difference of 0.17%), and Immigrants from Belarus (19.3%, a difference of 0.19%).
| Demographics | Rating | Rank | Single Female Poverty |
| Immigrants | Northern Europe | 99.6 /100 | #63 | Exceptional 19.2% |
| Immigrants | Europe | 99.6 /100 | #64 | Exceptional 19.2% |
| Cypriots | 99.6 /100 | #65 | Exceptional 19.2% |
| Palestinians | 99.6 /100 | #66 | Exceptional 19.2% |
| Immigrants | Egypt | 99.6 /100 | #67 | Exceptional 19.2% |
| Laotians | 99.5 /100 | #68 | Exceptional 19.3% |
| Paraguayans | 99.5 /100 | #69 | Exceptional 19.3% |
| Immigrants | Jordan | 99.4 /100 | #70 | Exceptional 19.3% |
| Immigrants | South Eastern Asia | 99.4 /100 | #71 | Exceptional 19.3% |
| Immigrants | Latvia | 99.4 /100 | #72 | Exceptional 19.3% |
| Immigrants | Peru | 99.4 /100 | #73 | Exceptional 19.3% |
| Immigrants | Belarus | 99.4 /100 | #74 | Exceptional 19.3% |
| Immigrants | Turkey | 99.4 /100 | #75 | Exceptional 19.4% |
| Peruvians | 99.4 /100 | #76 | Exceptional 19.4% |
| Immigrants | Russia | 99.3 /100 | #77 | Exceptional 19.4% |
Demographics Similar to Uruguayans by Single Female Poverty
In terms of single female poverty, the demographic groups most similar to Uruguayans are Pakistani (20.2%, a difference of 0.0%), Immigrants from England (20.2%, a difference of 0.030%), Immigrants from Hungary (20.2%, a difference of 0.050%), Immigrants from Morocco (20.2%, a difference of 0.080%), and Immigrants from Venezuela (20.2%, a difference of 0.12%).
| Demographics | Rating | Rank | Single Female Poverty |
| Immigrants | South Africa | 93.9 /100 | #125 | Exceptional 20.1% |
| Serbians | 93.3 /100 | #126 | Exceptional 20.1% |
| Mongolians | 93.2 /100 | #127 | Exceptional 20.2% |
| Immigrants | Spain | 92.7 /100 | #128 | Exceptional 20.2% |
| Immigrants | Morocco | 92.4 /100 | #129 | Exceptional 20.2% |
| Immigrants | Hungary | 92.3 /100 | #130 | Exceptional 20.2% |
| Pakistanis | 92.1 /100 | #131 | Exceptional 20.2% |
| Uruguayans | 92.1 /100 | #132 | Exceptional 20.2% |
| Immigrants | England | 91.9 /100 | #133 | Exceptional 20.2% |
| Immigrants | Venezuela | 91.5 /100 | #134 | Exceptional 20.2% |
| Immigrants | Iraq | 91.2 /100 | #135 | Exceptional 20.2% |
| Immigrants | Canada | 91.2 /100 | #136 | Exceptional 20.2% |
| Immigrants | Nepal | 90.6 /100 | #137 | Exceptional 20.3% |
| Slovenes | 90.5 /100 | #138 | Exceptional 20.3% |
| Immigrants | Kuwait | 90.4 /100 | #139 | Exceptional 20.3% |