Immigrants from Eastern Asia vs Uruguayan Single Female Poverty
COMPARE
Immigrants from Eastern Asia
Uruguayan
Single Female Poverty
Single Female Poverty Comparison
Immigrants from Eastern Asia
Uruguayans
18.1%
SINGLE FEMALE POVERTY
100.0/ 100
METRIC RATING
18th/ 347
METRIC RANK
20.2%
SINGLE FEMALE POVERTY
92.1/ 100
METRIC RATING
132nd/ 347
METRIC RANK
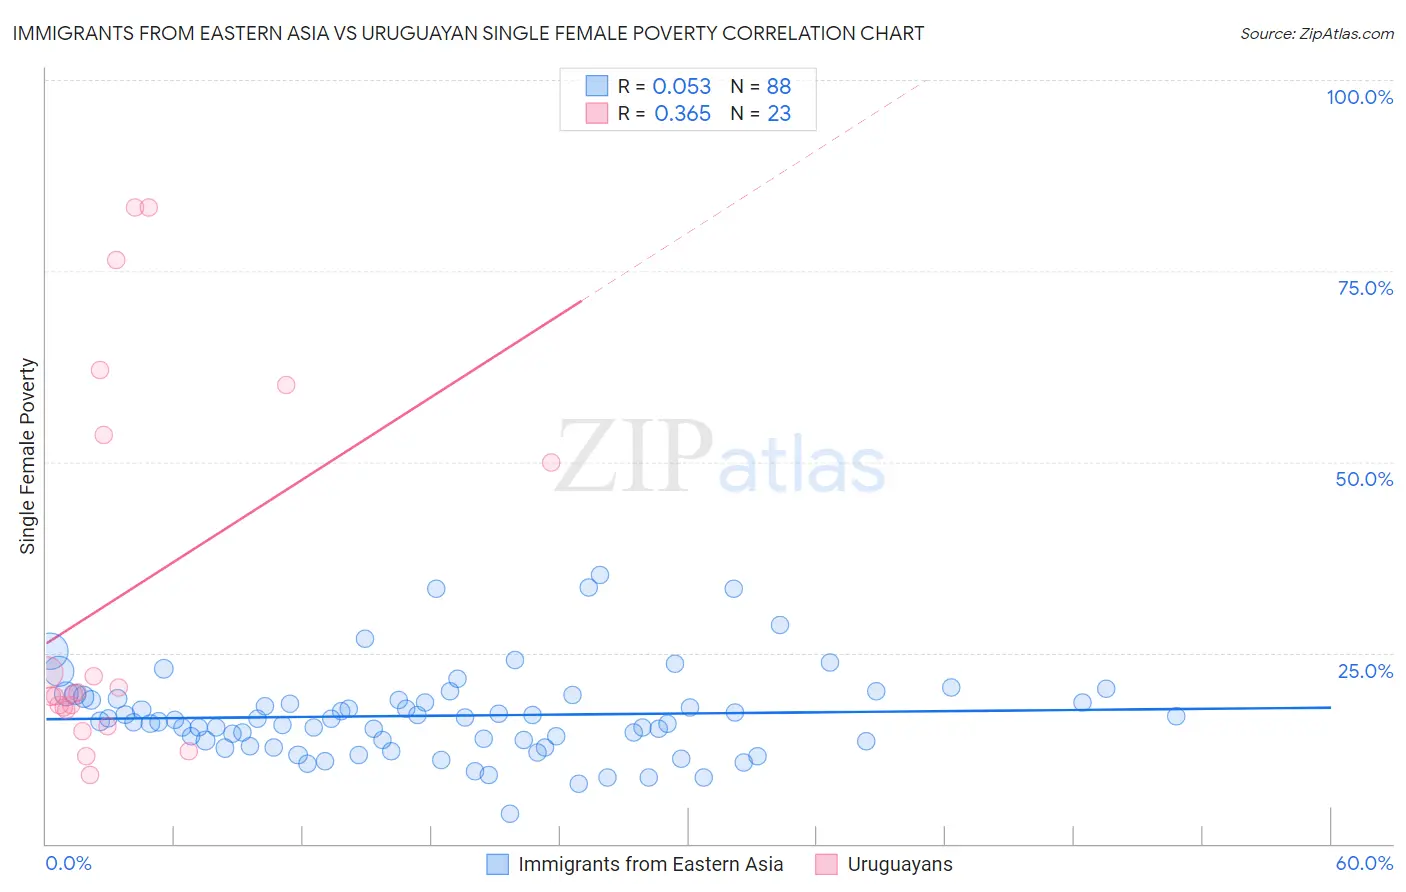
Immigrants from Eastern Asia vs Uruguayan Single Female Poverty Correlation Chart
The statistical analysis conducted on geographies consisting of 487,543,414 people shows a slight positive correlation between the proportion of Immigrants from Eastern Asia and poverty level among single females in the United States with a correlation coefficient (R) of 0.053 and weighted average of 18.1%. Similarly, the statistical analysis conducted on geographies consisting of 143,837,387 people shows a mild positive correlation between the proportion of Uruguayans and poverty level among single females in the United States with a correlation coefficient (R) of 0.365 and weighted average of 20.2%, a difference of 11.4%.
Single Female Poverty Correlation Summary
| Measurement | Immigrants from Eastern Asia | Uruguayan |
| Minimum | 3.9% | 9.0% |
| Maximum | 35.1% | 83.3% |
| Range | 31.2% | 74.3% |
| Mean | 16.8% | 32.4% |
| Median | 16.1% | 19.7% |
| Interquartile 25% (IQ1) | 13.4% | 17.5% |
| Interquartile 75% (IQ3) | 18.9% | 53.6% |
| Interquartile Range (IQR) | 5.5% | 36.1% |
| Standard Deviation (Sample) | 5.7% | 24.7% |
| Standard Deviation (Population) | 5.7% | 24.1% |
Similar Demographics by Single Female Poverty
Demographics Similar to Immigrants from Eastern Asia by Single Female Poverty
In terms of single female poverty, the demographic groups most similar to Immigrants from Eastern Asia are Immigrants from China (18.1%, a difference of 0.030%), Immigrants from Korea (18.1%, a difference of 0.28%), Immigrants from Greece (18.3%, a difference of 0.71%), Maltese (18.3%, a difference of 0.77%), and Burmese (18.3%, a difference of 0.78%).
| Demographics | Rating | Rank | Single Female Poverty |
| Immigrants | Lithuania | 100.0 /100 | #11 | Exceptional 17.8% |
| Immigrants | South Central Asia | 100.0 /100 | #12 | Exceptional 17.8% |
| Immigrants | Bolivia | 100.0 /100 | #13 | Exceptional 17.8% |
| Bolivians | 100.0 /100 | #14 | Exceptional 17.9% |
| Indians (Asian) | 100.0 /100 | #15 | Exceptional 17.9% |
| Iranians | 100.0 /100 | #16 | Exceptional 18.0% |
| Immigrants | Korea | 100.0 /100 | #17 | Exceptional 18.1% |
| Immigrants | Eastern Asia | 100.0 /100 | #18 | Exceptional 18.1% |
| Immigrants | China | 100.0 /100 | #19 | Exceptional 18.1% |
| Immigrants | Greece | 100.0 /100 | #20 | Exceptional 18.3% |
| Maltese | 100.0 /100 | #21 | Exceptional 18.3% |
| Burmese | 100.0 /100 | #22 | Exceptional 18.3% |
| Asians | 100.0 /100 | #23 | Exceptional 18.3% |
| Armenians | 100.0 /100 | #24 | Exceptional 18.3% |
| Immigrants | Singapore | 100.0 /100 | #25 | Exceptional 18.3% |
Demographics Similar to Uruguayans by Single Female Poverty
In terms of single female poverty, the demographic groups most similar to Uruguayans are Pakistani (20.2%, a difference of 0.0%), Immigrants from England (20.2%, a difference of 0.030%), Immigrants from Hungary (20.2%, a difference of 0.050%), Immigrants from Morocco (20.2%, a difference of 0.080%), and Immigrants from Venezuela (20.2%, a difference of 0.12%).
| Demographics | Rating | Rank | Single Female Poverty |
| Immigrants | South Africa | 93.9 /100 | #125 | Exceptional 20.1% |
| Serbians | 93.3 /100 | #126 | Exceptional 20.1% |
| Mongolians | 93.2 /100 | #127 | Exceptional 20.2% |
| Immigrants | Spain | 92.7 /100 | #128 | Exceptional 20.2% |
| Immigrants | Morocco | 92.4 /100 | #129 | Exceptional 20.2% |
| Immigrants | Hungary | 92.3 /100 | #130 | Exceptional 20.2% |
| Pakistanis | 92.1 /100 | #131 | Exceptional 20.2% |
| Uruguayans | 92.1 /100 | #132 | Exceptional 20.2% |
| Immigrants | England | 91.9 /100 | #133 | Exceptional 20.2% |
| Immigrants | Venezuela | 91.5 /100 | #134 | Exceptional 20.2% |
| Immigrants | Iraq | 91.2 /100 | #135 | Exceptional 20.2% |
| Immigrants | Canada | 91.2 /100 | #136 | Exceptional 20.2% |
| Immigrants | Nepal | 90.6 /100 | #137 | Exceptional 20.3% |
| Slovenes | 90.5 /100 | #138 | Exceptional 20.3% |
| Immigrants | Kuwait | 90.4 /100 | #139 | Exceptional 20.3% |