Pima vs Immigrants from Somalia Single Female Poverty
COMPARE
Pima
Immigrants from Somalia
Single Female Poverty
Single Female Poverty Comparison
Pima
Immigrants from Somalia
30.3%
SINGLE FEMALE POVERTY
0.0/ 100
METRIC RATING
338th/ 347
METRIC RANK
25.8%
SINGLE FEMALE POVERTY
0.0/ 100
METRIC RATING
316th/ 347
METRIC RANK
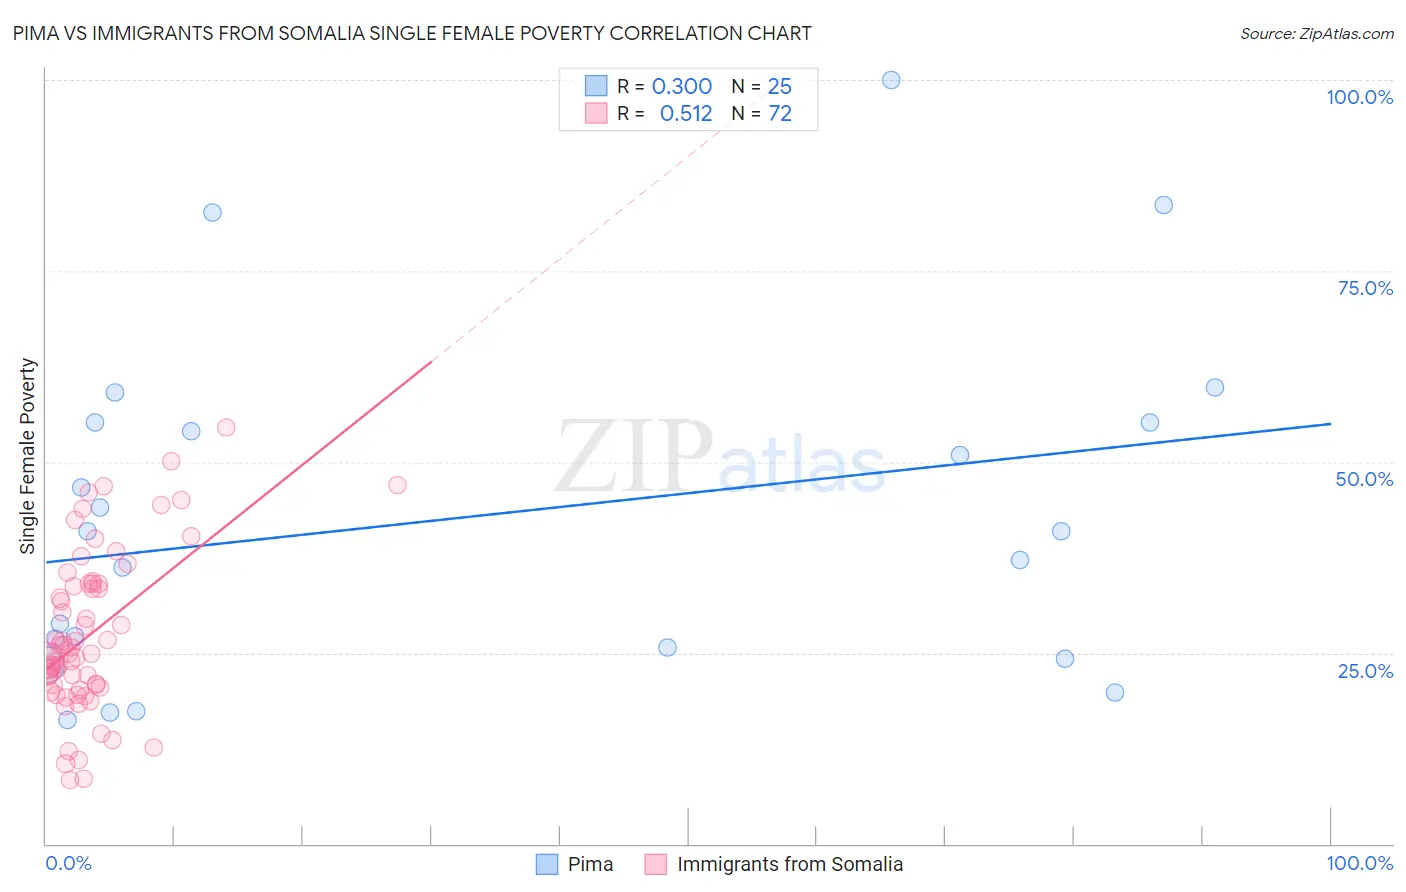
Pima vs Immigrants from Somalia Single Female Poverty Correlation Chart
The statistical analysis conducted on geographies consisting of 61,414,275 people shows a mild positive correlation between the proportion of Pima and poverty level among single females in the United States with a correlation coefficient (R) of 0.300 and weighted average of 30.3%. Similarly, the statistical analysis conducted on geographies consisting of 91,892,482 people shows a substantial positive correlation between the proportion of Immigrants from Somalia and poverty level among single females in the United States with a correlation coefficient (R) of 0.512 and weighted average of 25.8%, a difference of 17.6%.
Single Female Poverty Correlation Summary
| Measurement | Pima | Immigrants from Somalia |
| Minimum | 16.1% | 8.3% |
| Maximum | 100.0% | 54.5% |
| Range | 83.9% | 46.2% |
| Mean | 42.9% | 27.4% |
| Median | 41.0% | 25.0% |
| Interquartile 25% (IQ1) | 24.9% | 20.6% |
| Interquartile 75% (IQ3) | 55.1% | 34.0% |
| Interquartile Range (IQR) | 30.2% | 13.4% |
| Standard Deviation (Sample) | 22.3% | 10.4% |
| Standard Deviation (Population) | 21.8% | 10.3% |
Similar Demographics by Single Female Poverty
Demographics Similar to Pima by Single Female Poverty
In terms of single female poverty, the demographic groups most similar to Pima are Cheyenne (30.4%, a difference of 0.22%), Cajun (30.6%, a difference of 1.0%), Yuman (29.4%, a difference of 3.0%), Sioux (31.3%, a difference of 3.0%), and Colville (29.1%, a difference of 4.3%).
| Demographics | Rating | Rank | Single Female Poverty |
| Natives/Alaskans | 0.0 /100 | #331 | Tragic 28.2% |
| Yakama | 0.0 /100 | #332 | Tragic 28.3% |
| Ute | 0.0 /100 | #333 | Tragic 28.4% |
| Pueblo | 0.0 /100 | #334 | Tragic 28.6% |
| Immigrants | Yemen | 0.0 /100 | #335 | Tragic 28.9% |
| Colville | 0.0 /100 | #336 | Tragic 29.1% |
| Yuman | 0.0 /100 | #337 | Tragic 29.4% |
| Pima | 0.0 /100 | #338 | Tragic 30.3% |
| Cheyenne | 0.0 /100 | #339 | Tragic 30.4% |
| Cajuns | 0.0 /100 | #340 | Tragic 30.6% |
| Sioux | 0.0 /100 | #341 | Tragic 31.3% |
| Navajo | 0.0 /100 | #342 | Tragic 31.7% |
| Crow | 0.0 /100 | #343 | Tragic 32.4% |
| Lumbee | 0.0 /100 | #344 | Tragic 33.0% |
| Houma | 0.0 /100 | #345 | Tragic 33.8% |
Demographics Similar to Immigrants from Somalia by Single Female Poverty
In terms of single female poverty, the demographic groups most similar to Immigrants from Somalia are Iroquois (25.7%, a difference of 0.15%), Cherokee (25.7%, a difference of 0.47%), Comanche (25.6%, a difference of 0.83%), Ottawa (26.0%, a difference of 0.84%), and Paiute (25.5%, a difference of 0.94%).
| Demographics | Rating | Rank | Single Female Poverty |
| Dominicans | 0.0 /100 | #309 | Tragic 25.4% |
| Central American Indians | 0.0 /100 | #310 | Tragic 25.5% |
| Immigrants | Honduras | 0.0 /100 | #311 | Tragic 25.5% |
| Paiute | 0.0 /100 | #312 | Tragic 25.5% |
| Comanche | 0.0 /100 | #313 | Tragic 25.6% |
| Cherokee | 0.0 /100 | #314 | Tragic 25.7% |
| Iroquois | 0.0 /100 | #315 | Tragic 25.7% |
| Immigrants | Somalia | 0.0 /100 | #316 | Tragic 25.8% |
| Ottawa | 0.0 /100 | #317 | Tragic 26.0% |
| Chickasaw | 0.0 /100 | #318 | Tragic 26.3% |
| Blacks/African Americans | 0.0 /100 | #319 | Tragic 26.4% |
| Arapaho | 0.0 /100 | #320 | Tragic 26.4% |
| Yup'ik | 0.0 /100 | #321 | Tragic 26.6% |
| Seminole | 0.0 /100 | #322 | Tragic 26.8% |
| Chippewa | 0.0 /100 | #323 | Tragic 26.8% |