Pima vs Senegalese Single Female Poverty
COMPARE
Pima
Senegalese
Single Female Poverty
Single Female Poverty Comparison
Pima
Senegalese
30.3%
SINGLE FEMALE POVERTY
0.0/ 100
METRIC RATING
338th/ 347
METRIC RANK
23.0%
SINGLE FEMALE POVERTY
0.2/ 100
METRIC RATING
267th/ 347
METRIC RANK
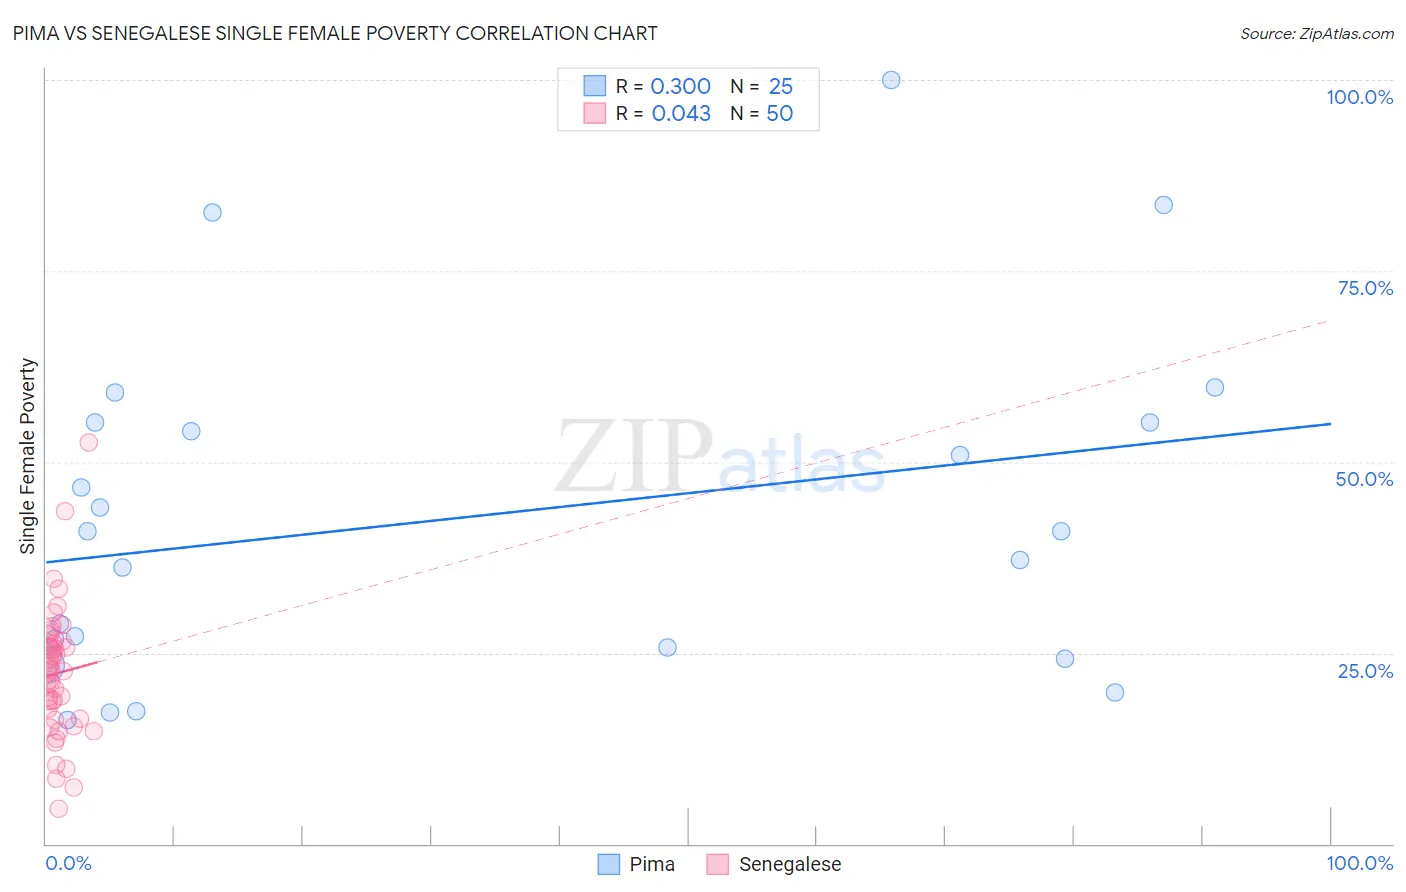
Pima vs Senegalese Single Female Poverty Correlation Chart
The statistical analysis conducted on geographies consisting of 61,414,275 people shows a mild positive correlation between the proportion of Pima and poverty level among single females in the United States with a correlation coefficient (R) of 0.300 and weighted average of 30.3%. Similarly, the statistical analysis conducted on geographies consisting of 77,927,948 people shows no correlation between the proportion of Senegalese and poverty level among single females in the United States with a correlation coefficient (R) of 0.043 and weighted average of 23.0%, a difference of 31.6%.
Single Female Poverty Correlation Summary
| Measurement | Pima | Senegalese |
| Minimum | 16.1% | 4.5% |
| Maximum | 100.0% | 52.6% |
| Range | 83.9% | 48.1% |
| Mean | 42.9% | 22.3% |
| Median | 41.0% | 22.7% |
| Interquartile 25% (IQ1) | 24.9% | 16.3% |
| Interquartile 75% (IQ3) | 55.1% | 26.2% |
| Interquartile Range (IQR) | 30.2% | 9.9% |
| Standard Deviation (Sample) | 22.3% | 8.6% |
| Standard Deviation (Population) | 21.8% | 8.5% |
Similar Demographics by Single Female Poverty
Demographics Similar to Pima by Single Female Poverty
In terms of single female poverty, the demographic groups most similar to Pima are Cheyenne (30.4%, a difference of 0.22%), Cajun (30.6%, a difference of 1.0%), Yuman (29.4%, a difference of 3.0%), Sioux (31.3%, a difference of 3.0%), and Colville (29.1%, a difference of 4.3%).
| Demographics | Rating | Rank | Single Female Poverty |
| Natives/Alaskans | 0.0 /100 | #331 | Tragic 28.2% |
| Yakama | 0.0 /100 | #332 | Tragic 28.3% |
| Ute | 0.0 /100 | #333 | Tragic 28.4% |
| Pueblo | 0.0 /100 | #334 | Tragic 28.6% |
| Immigrants | Yemen | 0.0 /100 | #335 | Tragic 28.9% |
| Colville | 0.0 /100 | #336 | Tragic 29.1% |
| Yuman | 0.0 /100 | #337 | Tragic 29.4% |
| Pima | 0.0 /100 | #338 | Tragic 30.3% |
| Cheyenne | 0.0 /100 | #339 | Tragic 30.4% |
| Cajuns | 0.0 /100 | #340 | Tragic 30.6% |
| Sioux | 0.0 /100 | #341 | Tragic 31.3% |
| Navajo | 0.0 /100 | #342 | Tragic 31.7% |
| Crow | 0.0 /100 | #343 | Tragic 32.4% |
| Lumbee | 0.0 /100 | #344 | Tragic 33.0% |
| Houma | 0.0 /100 | #345 | Tragic 33.8% |
Demographics Similar to Senegalese by Single Female Poverty
In terms of single female poverty, the demographic groups most similar to Senegalese are Immigrants from Micronesia (23.0%, a difference of 0.060%), Fijian (23.1%, a difference of 0.070%), Hmong (23.1%, a difference of 0.10%), Central American (23.0%, a difference of 0.27%), and Inupiat (23.1%, a difference of 0.35%).
| Demographics | Rating | Rank | Single Female Poverty |
| Celtics | 0.5 /100 | #260 | Tragic 22.7% |
| Immigrants | Cabo Verde | 0.4 /100 | #261 | Tragic 22.8% |
| British West Indians | 0.4 /100 | #262 | Tragic 22.8% |
| Scotch-Irish | 0.3 /100 | #263 | Tragic 22.9% |
| Immigrants | Laos | 0.3 /100 | #264 | Tragic 22.9% |
| Central Americans | 0.2 /100 | #265 | Tragic 23.0% |
| Immigrants | Micronesia | 0.2 /100 | #266 | Tragic 23.0% |
| Senegalese | 0.2 /100 | #267 | Tragic 23.0% |
| Fijians | 0.2 /100 | #268 | Tragic 23.1% |
| Hmong | 0.2 /100 | #269 | Tragic 23.1% |
| Inupiat | 0.2 /100 | #270 | Tragic 23.1% |
| Sub-Saharan Africans | 0.1 /100 | #271 | Tragic 23.2% |
| Immigrants | Senegal | 0.1 /100 | #272 | Tragic 23.2% |
| Alaska Natives | 0.1 /100 | #273 | Tragic 23.3% |
| Marshallese | 0.1 /100 | #274 | Tragic 23.3% |