Pima vs Immigrants from Somalia 9th Grade
COMPARE
Pima
Immigrants from Somalia
9th Grade
9th Grade Comparison
Pima
Immigrants from Somalia
93.9%
9TH GRADE
0.4/ 100
METRIC RATING
260th/ 347
METRIC RANK
94.1%
9TH GRADE
1.4/ 100
METRIC RATING
248th/ 347
METRIC RANK
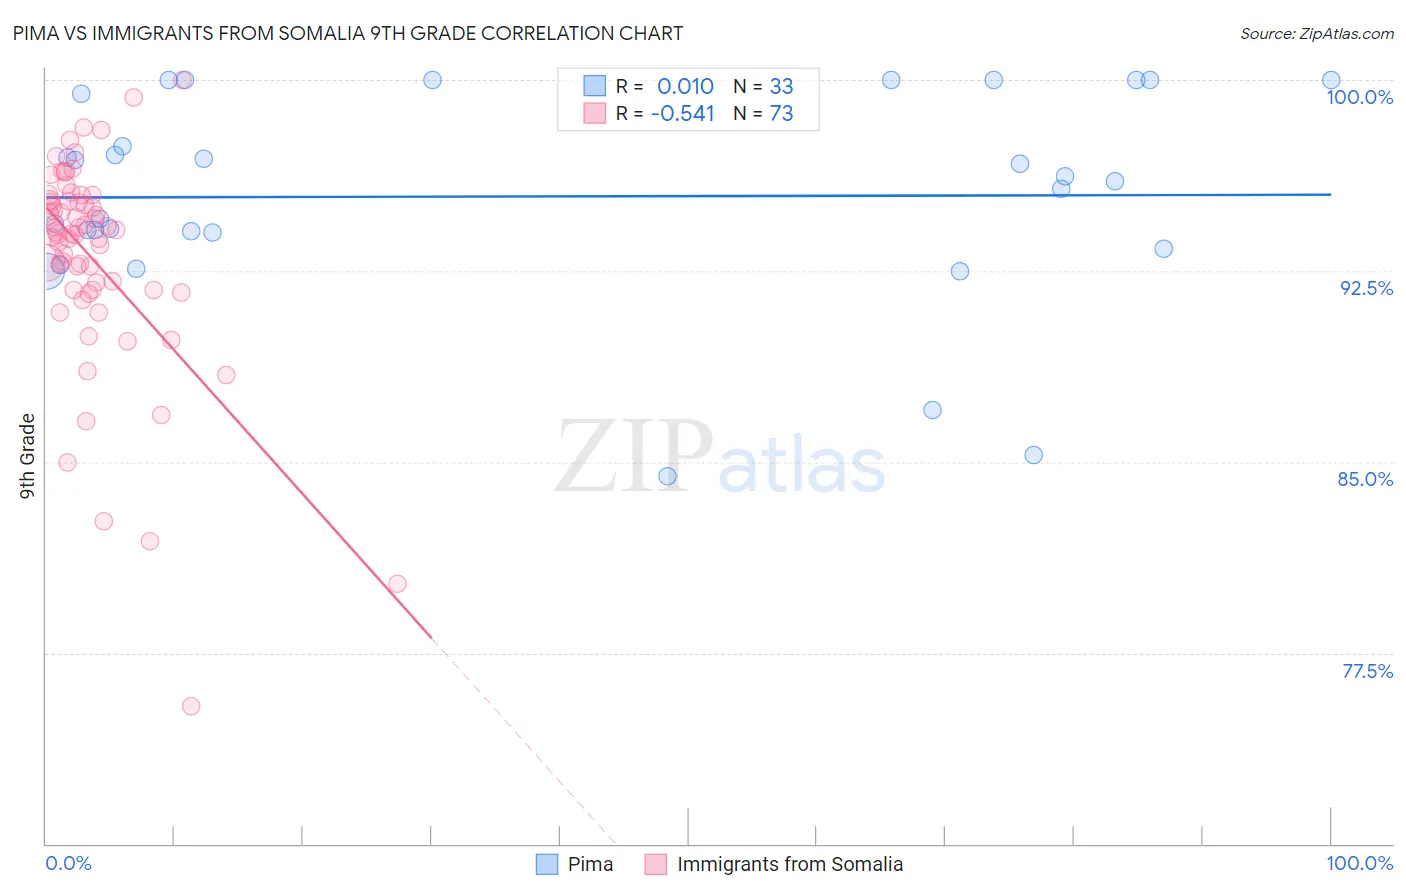
Pima vs Immigrants from Somalia 9th Grade Correlation Chart
The statistical analysis conducted on geographies consisting of 61,552,136 people shows no correlation between the proportion of Pima and percentage of population with at least 9th grade education in the United States with a correlation coefficient (R) of 0.010 and weighted average of 93.9%. Similarly, the statistical analysis conducted on geographies consisting of 92,097,499 people shows a substantial negative correlation between the proportion of Immigrants from Somalia and percentage of population with at least 9th grade education in the United States with a correlation coefficient (R) of -0.541 and weighted average of 94.1%, a difference of 0.22%.
9th Grade Correlation Summary
| Measurement | Pima | Immigrants from Somalia |
| Minimum | 84.5% | 75.4% |
| Maximum | 100.0% | 100.0% |
| Range | 15.5% | 24.6% |
| Mean | 95.4% | 93.0% |
| Median | 96.0% | 94.0% |
| Interquartile 25% (IQ1) | 93.7% | 91.7% |
| Interquartile 75% (IQ3) | 99.7% | 95.3% |
| Interquartile Range (IQR) | 6.0% | 3.5% |
| Standard Deviation (Sample) | 4.1% | 4.2% |
| Standard Deviation (Population) | 4.0% | 4.2% |
Demographics Similar to Pima and Immigrants from Somalia by 9th Grade
In terms of 9th grade, the demographic groups most similar to Pima are Immigrants from Thailand (93.9%, a difference of 0.010%), Ghanaian (93.9%, a difference of 0.010%), South American (93.9%, a difference of 0.010%), Immigrants from Costa Rica (94.0%, a difference of 0.020%), and Immigrants from Jamaica (93.9%, a difference of 0.020%). Similarly, the demographic groups most similar to Immigrants from Somalia are Uruguayan (94.1%, a difference of 0.010%), Immigrants from Hong Kong (94.1%, a difference of 0.010%), Senegalese (94.2%, a difference of 0.050%), Afghan (94.2%, a difference of 0.050%), and Paiute (94.2%, a difference of 0.060%).
| Demographics | Rating | Rank | 9th Grade |
| Dutch West Indians | 2.0 /100 | #244 | Tragic 94.2% |
| Paiute | 1.9 /100 | #245 | Tragic 94.2% |
| Senegalese | 1.9 /100 | #246 | Tragic 94.2% |
| Afghans | 1.8 /100 | #247 | Tragic 94.2% |
| Immigrants | Somalia | 1.4 /100 | #248 | Tragic 94.1% |
| Uruguayans | 1.3 /100 | #249 | Tragic 94.1% |
| Immigrants | Hong Kong | 1.3 /100 | #250 | Tragic 94.1% |
| Jamaicans | 1.0 /100 | #251 | Tragic 94.1% |
| Immigrants | Senegal | 0.9 /100 | #252 | Tragic 94.1% |
| Colombians | 0.8 /100 | #253 | Tragic 94.0% |
| U.S. Virgin Islanders | 0.7 /100 | #254 | Tragic 94.0% |
| Immigrants | Nigeria | 0.6 /100 | #255 | Tragic 94.0% |
| Immigrants | Afghanistan | 0.5 /100 | #256 | Tragic 94.0% |
| Immigrants | Costa Rica | 0.5 /100 | #257 | Tragic 94.0% |
| Immigrants | Thailand | 0.5 /100 | #258 | Tragic 93.9% |
| Ghanaians | 0.5 /100 | #259 | Tragic 93.9% |
| Pima | 0.4 /100 | #260 | Tragic 93.9% |
| South Americans | 0.4 /100 | #261 | Tragic 93.9% |
| Immigrants | Jamaica | 0.4 /100 | #262 | Tragic 93.9% |
| Immigrants | Uzbekistan | 0.4 /100 | #263 | Tragic 93.9% |
| Immigrants | Congo | 0.4 /100 | #264 | Tragic 93.9% |