Pima vs South American Single Female Poverty
COMPARE
Pima
South American
Single Female Poverty
Single Female Poverty Comparison
Pima
South Americans
30.3%
SINGLE FEMALE POVERTY
0.0/ 100
METRIC RATING
338th/ 347
METRIC RANK
20.0%
SINGLE FEMALE POVERTY
95.1/ 100
METRIC RATING
120th/ 347
METRIC RANK
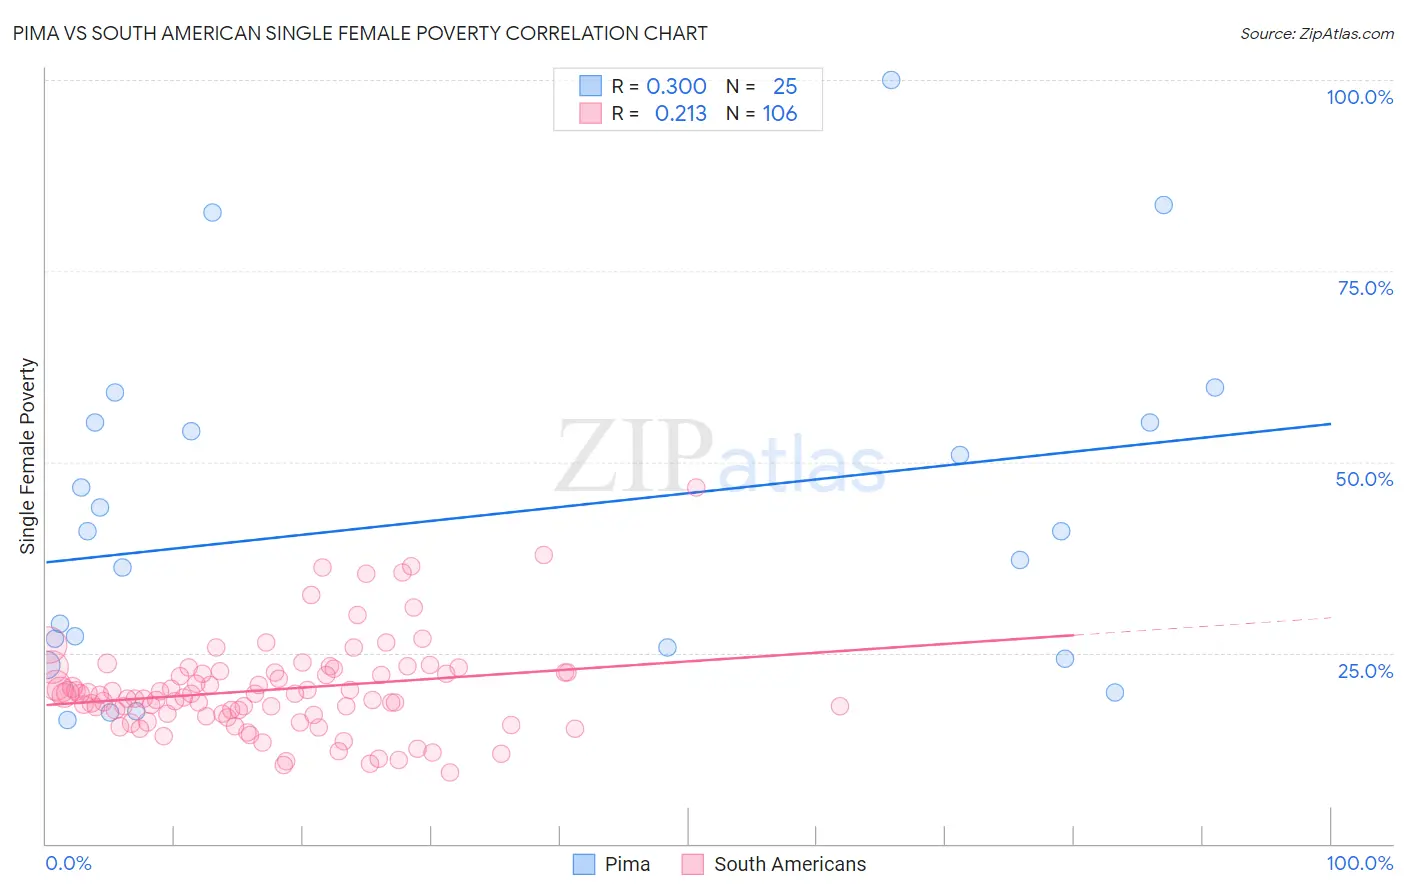
Pima vs South American Single Female Poverty Correlation Chart
The statistical analysis conducted on geographies consisting of 61,414,275 people shows a mild positive correlation between the proportion of Pima and poverty level among single females in the United States with a correlation coefficient (R) of 0.300 and weighted average of 30.3%. Similarly, the statistical analysis conducted on geographies consisting of 482,993,980 people shows a weak positive correlation between the proportion of South Americans and poverty level among single females in the United States with a correlation coefficient (R) of 0.213 and weighted average of 20.0%, a difference of 51.4%.
Single Female Poverty Correlation Summary
| Measurement | Pima | South American |
| Minimum | 16.1% | 9.4% |
| Maximum | 100.0% | 46.7% |
| Range | 83.9% | 37.3% |
| Mean | 42.9% | 20.2% |
| Median | 41.0% | 19.5% |
| Interquartile 25% (IQ1) | 24.9% | 16.9% |
| Interquartile 75% (IQ3) | 55.1% | 22.4% |
| Interquartile Range (IQR) | 30.2% | 5.5% |
| Standard Deviation (Sample) | 22.3% | 6.2% |
| Standard Deviation (Population) | 21.8% | 6.2% |
Similar Demographics by Single Female Poverty
Demographics Similar to Pima by Single Female Poverty
In terms of single female poverty, the demographic groups most similar to Pima are Cheyenne (30.4%, a difference of 0.22%), Cajun (30.6%, a difference of 1.0%), Yuman (29.4%, a difference of 3.0%), Sioux (31.3%, a difference of 3.0%), and Colville (29.1%, a difference of 4.3%).
| Demographics | Rating | Rank | Single Female Poverty |
| Natives/Alaskans | 0.0 /100 | #331 | Tragic 28.2% |
| Yakama | 0.0 /100 | #332 | Tragic 28.3% |
| Ute | 0.0 /100 | #333 | Tragic 28.4% |
| Pueblo | 0.0 /100 | #334 | Tragic 28.6% |
| Immigrants | Yemen | 0.0 /100 | #335 | Tragic 28.9% |
| Colville | 0.0 /100 | #336 | Tragic 29.1% |
| Yuman | 0.0 /100 | #337 | Tragic 29.4% |
| Pima | 0.0 /100 | #338 | Tragic 30.3% |
| Cheyenne | 0.0 /100 | #339 | Tragic 30.4% |
| Cajuns | 0.0 /100 | #340 | Tragic 30.6% |
| Sioux | 0.0 /100 | #341 | Tragic 31.3% |
| Navajo | 0.0 /100 | #342 | Tragic 31.7% |
| Crow | 0.0 /100 | #343 | Tragic 32.4% |
| Lumbee | 0.0 /100 | #344 | Tragic 33.0% |
| Houma | 0.0 /100 | #345 | Tragic 33.8% |
Demographics Similar to South Americans by Single Female Poverty
In terms of single female poverty, the demographic groups most similar to South Americans are Immigrants from Switzerland (20.0%, a difference of 0.030%), Immigrants from South America (20.0%, a difference of 0.060%), Immigrants from Afghanistan (20.0%, a difference of 0.10%), Immigrants from Ethiopia (20.0%, a difference of 0.10%), and Polish (20.0%, a difference of 0.17%).
| Demographics | Rating | Rank | Single Female Poverty |
| Immigrants | Zimbabwe | 95.9 /100 | #113 | Exceptional 20.0% |
| Immigrants | Colombia | 95.9 /100 | #114 | Exceptional 20.0% |
| Immigrants | Northern Africa | 95.8 /100 | #115 | Exceptional 20.0% |
| Immigrants | Kazakhstan | 95.7 /100 | #116 | Exceptional 20.0% |
| Poles | 95.6 /100 | #117 | Exceptional 20.0% |
| Immigrants | Afghanistan | 95.4 /100 | #118 | Exceptional 20.0% |
| Immigrants | Ethiopia | 95.4 /100 | #119 | Exceptional 20.0% |
| South Americans | 95.1 /100 | #120 | Exceptional 20.0% |
| Immigrants | Switzerland | 95.1 /100 | #121 | Exceptional 20.0% |
| Immigrants | South America | 95.0 /100 | #122 | Exceptional 20.0% |
| Brazilians | 94.4 /100 | #123 | Exceptional 20.1% |
| Immigrants | Chile | 94.3 /100 | #124 | Exceptional 20.1% |
| Immigrants | South Africa | 93.9 /100 | #125 | Exceptional 20.1% |
| Serbians | 93.3 /100 | #126 | Exceptional 20.1% |
| Mongolians | 93.2 /100 | #127 | Exceptional 20.2% |