Pima vs Immigrants from Somalia High School Diploma
COMPARE
Pima
Immigrants from Somalia
High School Diploma
High School Diploma Comparison
Pima
Immigrants from Somalia
81.6%
HIGH SCHOOL DIPLOMA
0.0/ 100
METRIC RATING
339th/ 347
METRIC RANK
88.4%
HIGH SCHOOL DIPLOMA
11.3/ 100
METRIC RATING
213th/ 347
METRIC RANK
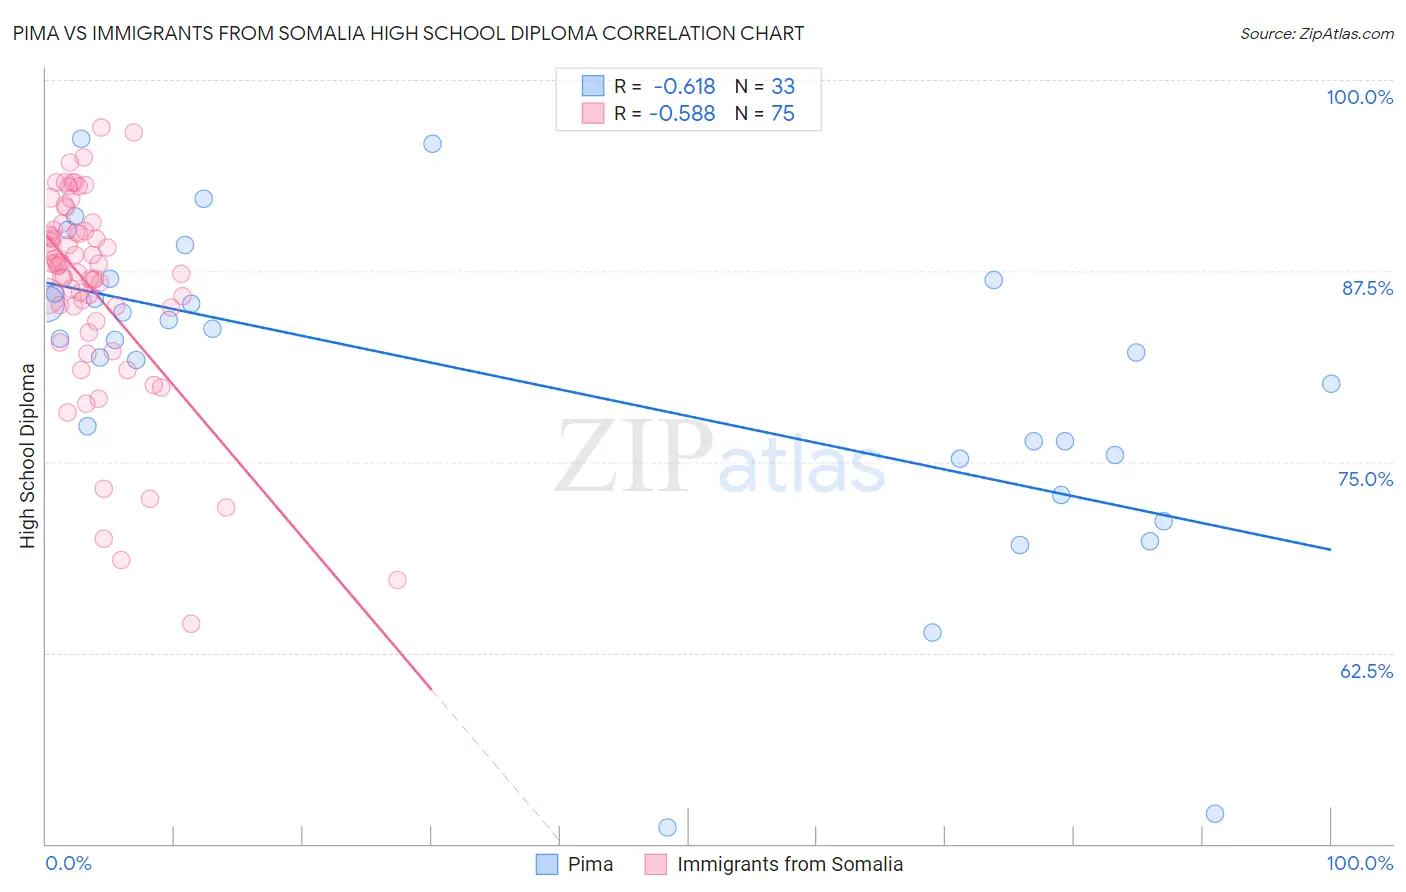
Pima vs Immigrants from Somalia High School Diploma Correlation Chart
The statistical analysis conducted on geographies consisting of 61,552,828 people shows a significant negative correlation between the proportion of Pima and percentage of population with at least high school diploma education in the United States with a correlation coefficient (R) of -0.618 and weighted average of 81.6%. Similarly, the statistical analysis conducted on geographies consisting of 92,101,093 people shows a substantial negative correlation between the proportion of Immigrants from Somalia and percentage of population with at least high school diploma education in the United States with a correlation coefficient (R) of -0.588 and weighted average of 88.4%, a difference of 8.4%.
High School Diploma Correlation Summary
| Measurement | Pima | Immigrants from Somalia |
| Minimum | 51.1% | 64.4% |
| Maximum | 96.1% | 96.9% |
| Range | 45.1% | 32.5% |
| Mean | 80.2% | 86.2% |
| Median | 83.0% | 87.8% |
| Interquartile 25% (IQ1) | 75.3% | 84.2% |
| Interquartile 75% (IQ3) | 86.4% | 90.1% |
| Interquartile Range (IQR) | 11.1% | 6.0% |
| Standard Deviation (Sample) | 10.6% | 6.8% |
| Standard Deviation (Population) | 10.4% | 6.7% |
Similar Demographics by High School Diploma
Demographics Similar to Pima by High School Diploma
In terms of high school diploma, the demographic groups most similar to Pima are Salvadoran (81.7%, a difference of 0.10%), Houma (81.5%, a difference of 0.11%), Mexican (81.4%, a difference of 0.26%), Immigrants from Yemen (81.8%, a difference of 0.27%), and Immigrants from Guatemala (81.4%, a difference of 0.31%).
| Demographics | Rating | Rank | High School Diploma |
| Immigrants | Honduras | 0.0 /100 | #332 | Tragic 82.5% |
| Immigrants | Latin America | 0.0 /100 | #333 | Tragic 82.1% |
| Tohono O'odham | 0.0 /100 | #334 | Tragic 82.1% |
| Guatemalans | 0.0 /100 | #335 | Tragic 82.0% |
| Immigrants | Dominican Republic | 0.0 /100 | #336 | Tragic 82.0% |
| Immigrants | Yemen | 0.0 /100 | #337 | Tragic 81.8% |
| Salvadorans | 0.0 /100 | #338 | Tragic 81.7% |
| Pima | 0.0 /100 | #339 | Tragic 81.6% |
| Houma | 0.0 /100 | #340 | Tragic 81.5% |
| Mexicans | 0.0 /100 | #341 | Tragic 81.4% |
| Immigrants | Guatemala | 0.0 /100 | #342 | Tragic 81.4% |
| Immigrants | El Salvador | 0.0 /100 | #343 | Tragic 80.8% |
| Immigrants | Central America | 0.0 /100 | #344 | Tragic 80.1% |
| Yakama | 0.0 /100 | #345 | Tragic 80.0% |
| Spanish American Indians | 0.0 /100 | #346 | Tragic 79.8% |
Demographics Similar to Immigrants from Somalia by High School Diploma
In terms of high school diploma, the demographic groups most similar to Immigrants from Somalia are Immigrants from Cameroon (88.4%, a difference of 0.010%), Crow (88.4%, a difference of 0.020%), Chickasaw (88.4%, a difference of 0.020%), Immigrants from Africa (88.4%, a difference of 0.030%), and South American Indian (88.5%, a difference of 0.040%).
| Demographics | Rating | Rank | High School Diploma |
| Arapaho | 16.1 /100 | #206 | Poor 88.6% |
| Immigrants | Sierra Leone | 15.8 /100 | #207 | Poor 88.6% |
| Portuguese | 14.4 /100 | #208 | Poor 88.5% |
| Cherokee | 14.3 /100 | #209 | Poor 88.5% |
| Samoans | 14.0 /100 | #210 | Poor 88.5% |
| Inupiat | 13.1 /100 | #211 | Poor 88.5% |
| South American Indians | 12.2 /100 | #212 | Poor 88.5% |
| Immigrants | Somalia | 11.3 /100 | #213 | Poor 88.4% |
| Immigrants | Cameroon | 10.9 /100 | #214 | Poor 88.4% |
| Crow | 10.9 /100 | #215 | Poor 88.4% |
| Chickasaw | 10.7 /100 | #216 | Poor 88.4% |
| Immigrants | Africa | 10.6 /100 | #217 | Poor 88.4% |
| Immigrants | Bolivia | 10.3 /100 | #218 | Poor 88.4% |
| Costa Ricans | 9.6 /100 | #219 | Tragic 88.4% |
| Tongans | 9.5 /100 | #220 | Tragic 88.4% |