French vs Immigrants from Somalia Single Female Poverty
COMPARE
French
Immigrants from Somalia
Single Female Poverty
Single Female Poverty Comparison
French
Immigrants from Somalia
22.2%
SINGLE FEMALE POVERTY
2.3/ 100
METRIC RATING
240th/ 347
METRIC RANK
25.8%
SINGLE FEMALE POVERTY
0.0/ 100
METRIC RATING
316th/ 347
METRIC RANK
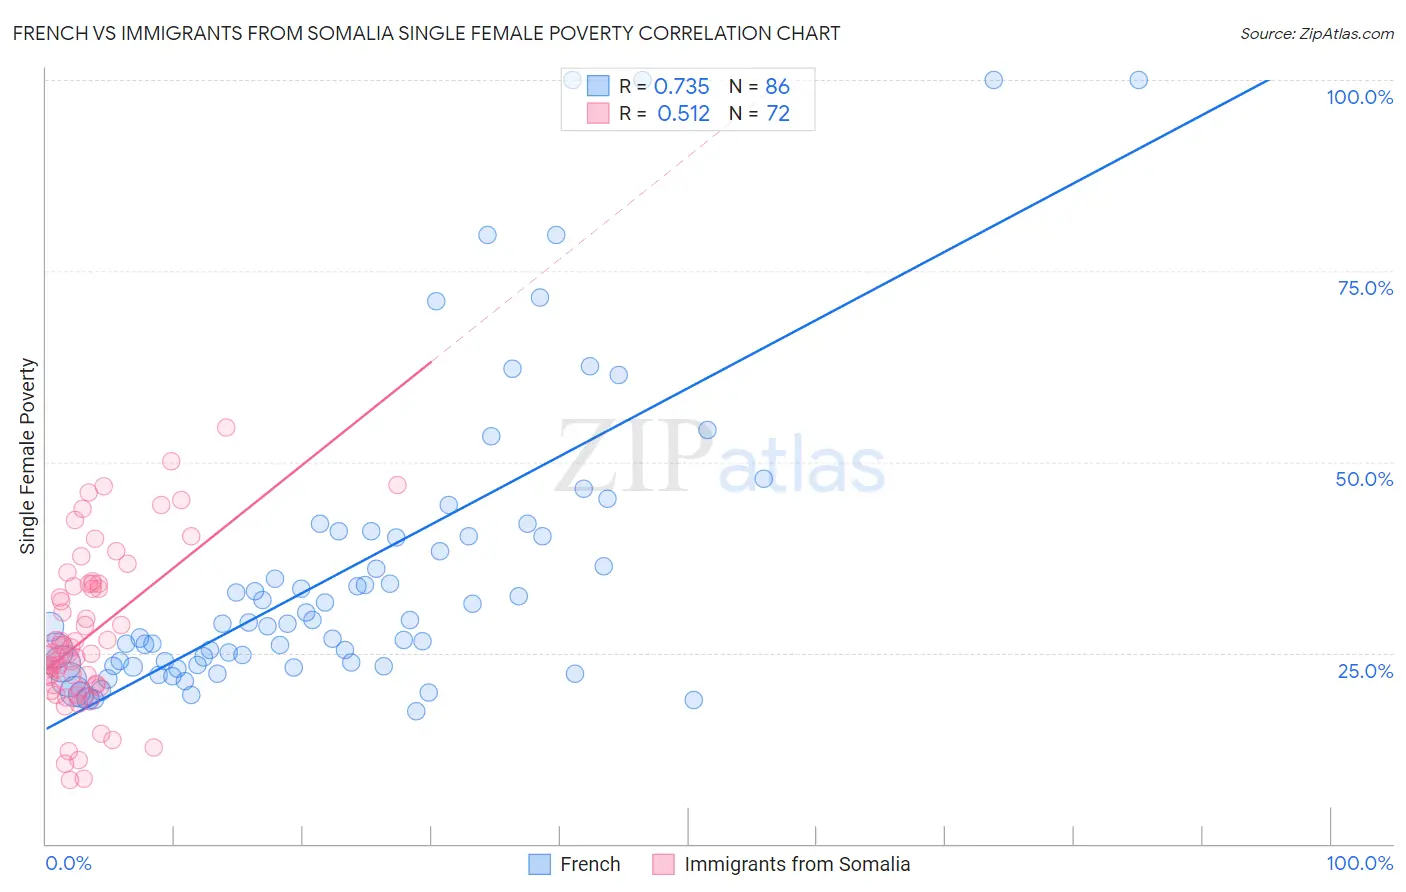
French vs Immigrants from Somalia Single Female Poverty Correlation Chart
The statistical analysis conducted on geographies consisting of 551,878,026 people shows a strong positive correlation between the proportion of French and poverty level among single females in the United States with a correlation coefficient (R) of 0.735 and weighted average of 22.2%. Similarly, the statistical analysis conducted on geographies consisting of 91,892,482 people shows a substantial positive correlation between the proportion of Immigrants from Somalia and poverty level among single females in the United States with a correlation coefficient (R) of 0.512 and weighted average of 25.8%, a difference of 16.0%.
Single Female Poverty Correlation Summary
| Measurement | French | Immigrants from Somalia |
| Minimum | 17.3% | 8.3% |
| Maximum | 100.0% | 54.5% |
| Range | 82.7% | 46.2% |
| Mean | 36.0% | 27.4% |
| Median | 28.8% | 25.0% |
| Interquartile 25% (IQ1) | 23.4% | 20.6% |
| Interquartile 75% (IQ3) | 40.3% | 34.0% |
| Interquartile Range (IQR) | 17.0% | 13.4% |
| Standard Deviation (Sample) | 19.8% | 10.4% |
| Standard Deviation (Population) | 19.7% | 10.3% |
Similar Demographics by Single Female Poverty
Demographics Similar to French by Single Female Poverty
In terms of single female poverty, the demographic groups most similar to French are Cape Verdean (22.3%, a difference of 0.14%), Bermudan (22.3%, a difference of 0.21%), Malaysian (22.2%, a difference of 0.26%), French Canadian (22.2%, a difference of 0.27%), and West Indian (22.3%, a difference of 0.30%).
| Demographics | Rating | Rank | Single Female Poverty |
| Spaniards | 4.7 /100 | #233 | Tragic 22.0% |
| Spanish | 4.7 /100 | #234 | Tragic 22.0% |
| Dutch | 4.6 /100 | #235 | Tragic 22.0% |
| Immigrants | Ecuador | 4.2 /100 | #236 | Tragic 22.0% |
| Vietnamese | 4.0 /100 | #237 | Tragic 22.0% |
| French Canadians | 2.8 /100 | #238 | Tragic 22.2% |
| Malaysians | 2.8 /100 | #239 | Tragic 22.2% |
| French | 2.3 /100 | #240 | Tragic 22.2% |
| Cape Verdeans | 2.1 /100 | #241 | Tragic 22.3% |
| Bermudans | 2.0 /100 | #242 | Tragic 22.3% |
| West Indians | 1.9 /100 | #243 | Tragic 22.3% |
| Immigrants | Middle Africa | 1.9 /100 | #244 | Tragic 22.3% |
| Immigrants | Bangladesh | 1.8 /100 | #245 | Tragic 22.3% |
| Liberians | 1.4 /100 | #246 | Tragic 22.4% |
| Immigrants | El Salvador | 1.4 /100 | #247 | Tragic 22.4% |
Demographics Similar to Immigrants from Somalia by Single Female Poverty
In terms of single female poverty, the demographic groups most similar to Immigrants from Somalia are Iroquois (25.7%, a difference of 0.15%), Cherokee (25.7%, a difference of 0.47%), Comanche (25.6%, a difference of 0.83%), Ottawa (26.0%, a difference of 0.84%), and Paiute (25.5%, a difference of 0.94%).
| Demographics | Rating | Rank | Single Female Poverty |
| Dominicans | 0.0 /100 | #309 | Tragic 25.4% |
| Central American Indians | 0.0 /100 | #310 | Tragic 25.5% |
| Immigrants | Honduras | 0.0 /100 | #311 | Tragic 25.5% |
| Paiute | 0.0 /100 | #312 | Tragic 25.5% |
| Comanche | 0.0 /100 | #313 | Tragic 25.6% |
| Cherokee | 0.0 /100 | #314 | Tragic 25.7% |
| Iroquois | 0.0 /100 | #315 | Tragic 25.7% |
| Immigrants | Somalia | 0.0 /100 | #316 | Tragic 25.8% |
| Ottawa | 0.0 /100 | #317 | Tragic 26.0% |
| Chickasaw | 0.0 /100 | #318 | Tragic 26.3% |
| Blacks/African Americans | 0.0 /100 | #319 | Tragic 26.4% |
| Arapaho | 0.0 /100 | #320 | Tragic 26.4% |
| Yup'ik | 0.0 /100 | #321 | Tragic 26.6% |
| Seminole | 0.0 /100 | #322 | Tragic 26.8% |
| Chippewa | 0.0 /100 | #323 | Tragic 26.8% |