Panamanian vs Immigrants from Poland Family Households with Children
COMPARE
Panamanian
Immigrants from Poland
Family Households with Children
Family Households with Children Comparison
Panamanians
Immigrants from Poland
28.2%
FAMILY HOUSEHOLDS WITH CHILDREN
99.3/ 100
METRIC RATING
93rd/ 347
METRIC RANK
27.2%
FAMILY HOUSEHOLDS WITH CHILDREN
16.4/ 100
METRIC RATING
208th/ 347
METRIC RANK
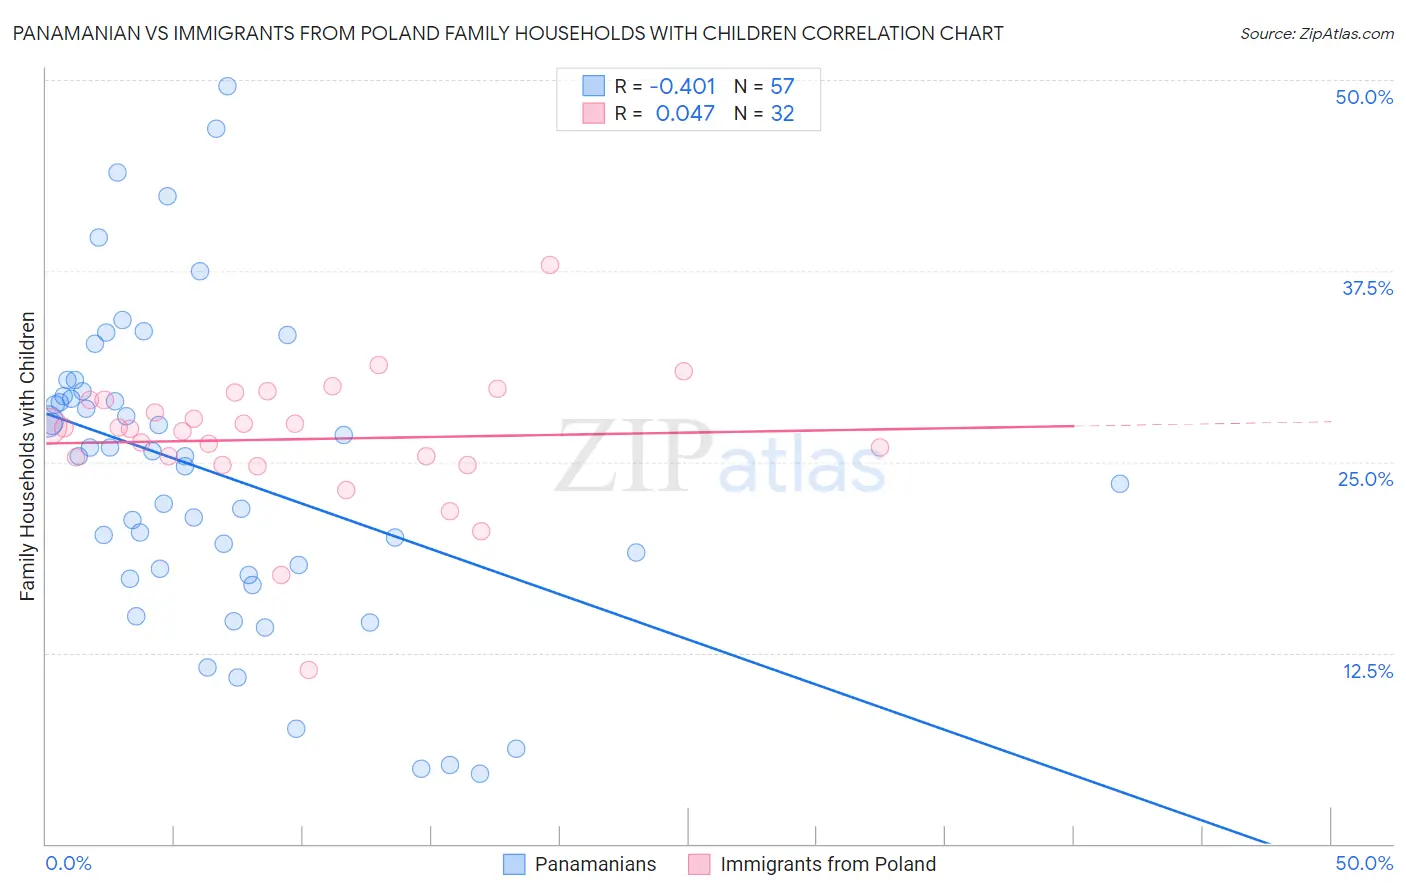
Panamanian vs Immigrants from Poland Family Households with Children Correlation Chart
The statistical analysis conducted on geographies consisting of 281,035,493 people shows a moderate negative correlation between the proportion of Panamanians and percentage of family households with children in the United States with a correlation coefficient (R) of -0.401 and weighted average of 28.2%. Similarly, the statistical analysis conducted on geographies consisting of 304,692,657 people shows no correlation between the proportion of Immigrants from Poland and percentage of family households with children in the United States with a correlation coefficient (R) of 0.047 and weighted average of 27.2%, a difference of 3.6%.
Family Households with Children Correlation Summary
| Measurement | Panamanian | Immigrants from Poland |
| Minimum | 4.6% | 11.4% |
| Maximum | 49.6% | 37.9% |
| Range | 45.0% | 26.5% |
| Mean | 24.4% | 26.5% |
| Median | 25.4% | 27.2% |
| Interquartile 25% (IQ1) | 17.8% | 25.0% |
| Interquartile 75% (IQ3) | 29.4% | 29.0% |
| Interquartile Range (IQR) | 11.7% | 4.0% |
| Standard Deviation (Sample) | 10.2% | 4.5% |
| Standard Deviation (Population) | 10.1% | 4.4% |
Similar Demographics by Family Households with Children
Demographics Similar to Panamanians by Family Households with Children
In terms of family households with children, the demographic groups most similar to Panamanians are Immigrants from Colombia (28.2%, a difference of 0.050%), Chickasaw (28.2%, a difference of 0.11%), Immigrants from Nicaragua (28.2%, a difference of 0.11%), Immigrants from Liberia (28.2%, a difference of 0.13%), and Ute (28.2%, a difference of 0.14%).
| Demographics | Rating | Rank | Family Households with Children |
| Immigrants | Western Africa | 99.6 /100 | #86 | Exceptional 28.3% |
| Colombians | 99.6 /100 | #87 | Exceptional 28.3% |
| Liberians | 99.6 /100 | #88 | Exceptional 28.3% |
| Immigrants | Costa Rica | 99.6 /100 | #89 | Exceptional 28.3% |
| Immigrants | Thailand | 99.5 /100 | #90 | Exceptional 28.2% |
| Immigrants | Liberia | 99.4 /100 | #91 | Exceptional 28.2% |
| Chickasaw | 99.4 /100 | #92 | Exceptional 28.2% |
| Panamanians | 99.3 /100 | #93 | Exceptional 28.2% |
| Immigrants | Colombia | 99.2 /100 | #94 | Exceptional 28.2% |
| Immigrants | Nicaragua | 99.1 /100 | #95 | Exceptional 28.2% |
| Ute | 99.1 /100 | #96 | Exceptional 28.2% |
| Chileans | 98.9 /100 | #97 | Exceptional 28.1% |
| Immigrants | Kenya | 98.9 /100 | #98 | Exceptional 28.1% |
| Immigrants | Azores | 98.8 /100 | #99 | Exceptional 28.1% |
| Indonesians | 98.8 /100 | #100 | Exceptional 28.1% |
Demographics Similar to Immigrants from Poland by Family Households with Children
In terms of family households with children, the demographic groups most similar to Immigrants from Poland are Dutch West Indian (27.2%, a difference of 0.030%), Immigrants from Ukraine (27.2%, a difference of 0.090%), Welsh (27.2%, a difference of 0.10%), Immigrants from Dominica (27.2%, a difference of 0.11%), and Okinawan (27.2%, a difference of 0.12%).
| Demographics | Rating | Rank | Family Households with Children |
| Bhutanese | 25.1 /100 | #201 | Fair 27.3% |
| Americans | 22.8 /100 | #202 | Fair 27.3% |
| Kiowa | 22.2 /100 | #203 | Fair 27.3% |
| Immigrants | Sudan | 21.6 /100 | #204 | Fair 27.3% |
| Immigrants | Haiti | 20.3 /100 | #205 | Fair 27.2% |
| Immigrants | Micronesia | 20.2 /100 | #206 | Fair 27.2% |
| Haitians | 19.8 /100 | #207 | Poor 27.2% |
| Immigrants | Poland | 16.4 /100 | #208 | Poor 27.2% |
| Dutch West Indians | 15.8 /100 | #209 | Poor 27.2% |
| Immigrants | Ukraine | 14.4 /100 | #210 | Poor 27.2% |
| Welsh | 14.2 /100 | #211 | Poor 27.2% |
| Immigrants | Dominica | 13.9 /100 | #212 | Poor 27.2% |
| Okinawans | 13.7 /100 | #213 | Poor 27.2% |
| Africans | 13.0 /100 | #214 | Poor 27.2% |
| Northern Europeans | 12.8 /100 | #215 | Poor 27.2% |