Panamanian vs Immigrants from Poland No Vehicles in Household
COMPARE
Panamanian
Immigrants from Poland
No Vehicles in Household
No Vehicles in Household Comparison
Panamanians
Immigrants from Poland
12.5%
NO VEHICLES IN HOUSEHOLD
0.2/ 100
METRIC RATING
269th/ 347
METRIC RANK
10.6%
NO VEHICLES IN HOUSEHOLD
38.4/ 100
METRIC RATING
187th/ 347
METRIC RANK
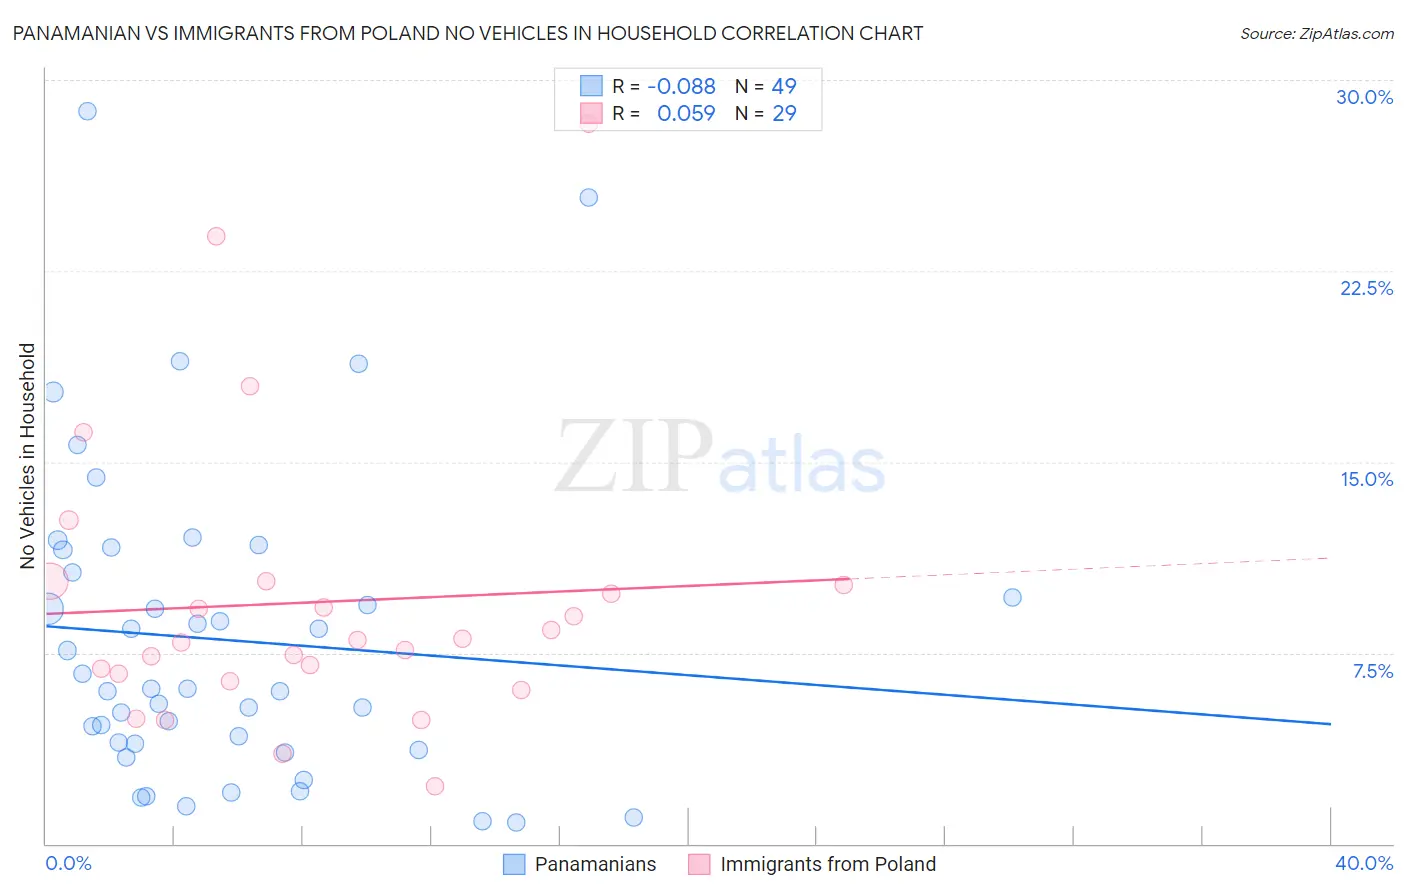
Panamanian vs Immigrants from Poland No Vehicles in Household Correlation Chart
The statistical analysis conducted on geographies consisting of 280,874,828 people shows a slight negative correlation between the proportion of Panamanians and percentage of households with no vehicle available in the United States with a correlation coefficient (R) of -0.088 and weighted average of 12.5%. Similarly, the statistical analysis conducted on geographies consisting of 304,302,908 people shows a slight positive correlation between the proportion of Immigrants from Poland and percentage of households with no vehicle available in the United States with a correlation coefficient (R) of 0.059 and weighted average of 10.6%, a difference of 18.6%.
No Vehicles in Household Correlation Summary
| Measurement | Panamanian | Immigrants from Poland |
| Minimum | 0.82% | 2.3% |
| Maximum | 28.8% | 28.3% |
| Range | 27.9% | 26.0% |
| Mean | 8.0% | 9.5% |
| Median | 6.1% | 8.0% |
| Interquartile 25% (IQ1) | 3.8% | 6.5% |
| Interquartile 75% (IQ3) | 11.1% | 10.2% |
| Interquartile Range (IQR) | 7.3% | 3.7% |
| Standard Deviation (Sample) | 6.1% | 5.7% |
| Standard Deviation (Population) | 6.1% | 5.6% |
Similar Demographics by No Vehicles in Household
Demographics Similar to Panamanians by No Vehicles in Household
In terms of no vehicles in household, the demographic groups most similar to Panamanians are Immigrants from Africa (12.5%, a difference of 0.13%), Immigrants from Europe (12.5%, a difference of 0.18%), Immigrants from Northern Africa (12.6%, a difference of 0.55%), Immigrants from Morocco (12.6%, a difference of 0.67%), and Israeli (12.4%, a difference of 0.76%).
| Demographics | Rating | Rank | No Vehicles in Household |
| Immigrants | Liberia | 0.6 /100 | #262 | Tragic 12.2% |
| Immigrants | Egypt | 0.6 /100 | #263 | Tragic 12.2% |
| Immigrants | Switzerland | 0.5 /100 | #264 | Tragic 12.3% |
| Africans | 0.4 /100 | #265 | Tragic 12.3% |
| Israelis | 0.3 /100 | #266 | Tragic 12.4% |
| Immigrants | Europe | 0.3 /100 | #267 | Tragic 12.5% |
| Immigrants | Africa | 0.2 /100 | #268 | Tragic 12.5% |
| Panamanians | 0.2 /100 | #269 | Tragic 12.5% |
| Immigrants | Northern Africa | 0.2 /100 | #270 | Tragic 12.6% |
| Immigrants | Morocco | 0.2 /100 | #271 | Tragic 12.6% |
| Bermudans | 0.1 /100 | #272 | Tragic 12.8% |
| Immigrants | France | 0.1 /100 | #273 | Tragic 12.9% |
| Immigrants | Singapore | 0.1 /100 | #274 | Tragic 12.9% |
| Immigrants | Albania | 0.1 /100 | #275 | Tragic 13.0% |
| Immigrants | Southern Europe | 0.1 /100 | #276 | Tragic 13.0% |
Demographics Similar to Immigrants from Poland by No Vehicles in Household
In terms of no vehicles in household, the demographic groups most similar to Immigrants from Poland are Immigrants from Armenia (10.6%, a difference of 0.12%), Immigrants from Eritrea (10.6%, a difference of 0.30%), German Russian (10.5%, a difference of 0.31%), South American (10.5%, a difference of 0.49%), and Immigrants from North Macedonia (10.6%, a difference of 0.54%).
| Demographics | Rating | Rank | No Vehicles in Household |
| Arabs | 45.3 /100 | #180 | Average 10.5% |
| Immigrants | Colombia | 44.1 /100 | #181 | Average 10.5% |
| Immigrants | Bulgaria | 43.8 /100 | #182 | Average 10.5% |
| Natives/Alaskans | 43.7 /100 | #183 | Average 10.5% |
| Immigrants | Nepal | 42.4 /100 | #184 | Average 10.5% |
| South Americans | 41.9 /100 | #185 | Average 10.5% |
| German Russians | 40.6 /100 | #186 | Average 10.5% |
| Immigrants | Poland | 38.4 /100 | #187 | Fair 10.6% |
| Immigrants | Armenia | 37.5 /100 | #188 | Fair 10.6% |
| Immigrants | Eritrea | 36.3 /100 | #189 | Fair 10.6% |
| Immigrants | North Macedonia | 34.6 /100 | #190 | Fair 10.6% |
| Immigrants | Northern Europe | 33.1 /100 | #191 | Fair 10.7% |
| Carpatho Rusyns | 32.1 /100 | #192 | Fair 10.7% |
| Ukrainians | 28.0 /100 | #193 | Fair 10.7% |
| Pueblo | 27.0 /100 | #194 | Fair 10.8% |