Palestinian vs Kenyan Unemployment Among Ages 35 to 44 years
COMPARE
Palestinian
Kenyan
Unemployment Among Ages 35 to 44 years
Unemployment Among Ages 35 to 44 years Comparison
Palestinians
Kenyans
4.3%
UNEMPLOYMENT AMONG AGES 35 TO 44 YEARS
98.8/ 100
METRIC RATING
39th/ 347
METRIC RANK
4.4%
UNEMPLOYMENT AMONG AGES 35 TO 44 YEARS
95.7/ 100
METRIC RATING
80th/ 347
METRIC RANK
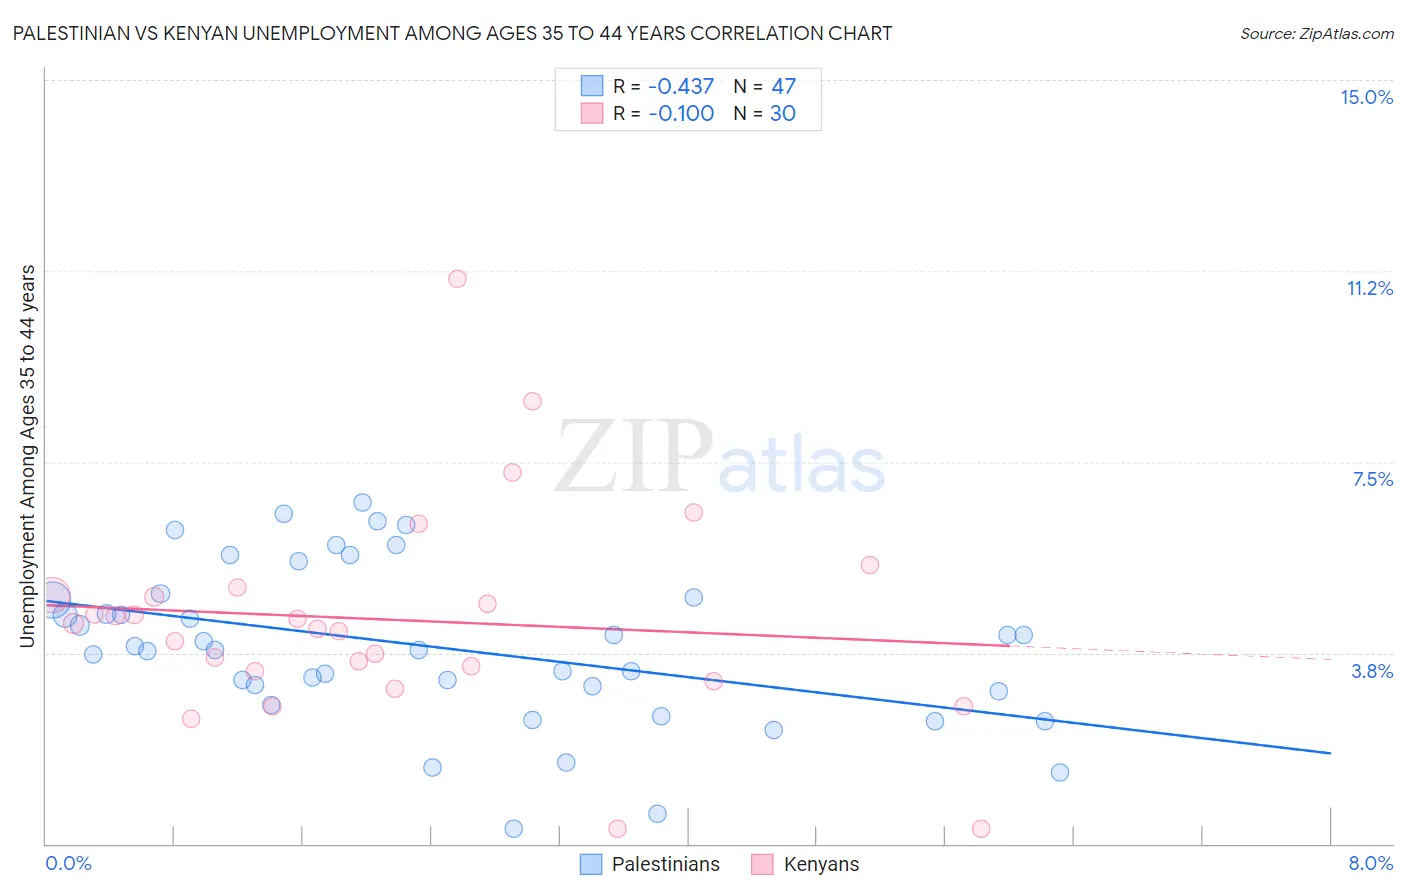
Palestinian vs Kenyan Unemployment Among Ages 35 to 44 years Correlation Chart
The statistical analysis conducted on geographies consisting of 214,645,990 people shows a moderate negative correlation between the proportion of Palestinians and unemployment rate among population between the ages 35 and 44 in the United States with a correlation coefficient (R) of -0.437 and weighted average of 4.3%. Similarly, the statistical analysis conducted on geographies consisting of 167,131,025 people shows a slight negative correlation between the proportion of Kenyans and unemployment rate among population between the ages 35 and 44 in the United States with a correlation coefficient (R) of -0.100 and weighted average of 4.4%, a difference of 2.5%.
Unemployment Among Ages 35 to 44 years Correlation Summary
| Measurement | Palestinian | Kenyan |
| Minimum | 0.30% | 0.30% |
| Maximum | 6.7% | 11.1% |
| Range | 6.4% | 10.8% |
| Mean | 3.9% | 4.4% |
| Median | 3.8% | 4.3% |
| Interquartile 25% (IQ1) | 3.0% | 3.4% |
| Interquartile 75% (IQ3) | 4.8% | 4.9% |
| Interquartile Range (IQR) | 1.8% | 1.5% |
| Standard Deviation (Sample) | 1.5% | 2.1% |
| Standard Deviation (Population) | 1.5% | 2.1% |
Similar Demographics by Unemployment Among Ages 35 to 44 years
Demographics Similar to Palestinians by Unemployment Among Ages 35 to 44 years
In terms of unemployment among ages 35 to 44 years, the demographic groups most similar to Palestinians are Burmese (4.3%, a difference of 0.060%), Zimbabwean (4.3%, a difference of 0.060%), Immigrants from Zimbabwe (4.3%, a difference of 0.13%), Belgian (4.3%, a difference of 0.16%), and Mongolian (4.3%, a difference of 0.17%).
| Demographics | Rating | Rank | Unemployment Among Ages 35 to 44 years |
| Chinese | 99.1 /100 | #32 | Exceptional 4.3% |
| Immigrants | Sri Lanka | 99.1 /100 | #33 | Exceptional 4.3% |
| Jordanians | 99.0 /100 | #34 | Exceptional 4.3% |
| Luxembourgers | 99.0 /100 | #35 | Exceptional 4.3% |
| Mongolians | 98.9 /100 | #36 | Exceptional 4.3% |
| Immigrants | Zimbabwe | 98.9 /100 | #37 | Exceptional 4.3% |
| Burmese | 98.9 /100 | #38 | Exceptional 4.3% |
| Palestinians | 98.8 /100 | #39 | Exceptional 4.3% |
| Zimbabweans | 98.8 /100 | #40 | Exceptional 4.3% |
| Belgians | 98.7 /100 | #41 | Exceptional 4.3% |
| Germans | 98.7 /100 | #42 | Exceptional 4.3% |
| Eastern Europeans | 98.7 /100 | #43 | Exceptional 4.3% |
| Immigrants | Malaysia | 98.7 /100 | #44 | Exceptional 4.3% |
| Immigrants | Korea | 98.4 /100 | #45 | Exceptional 4.3% |
| Immigrants | Belgium | 98.4 /100 | #46 | Exceptional 4.3% |
Demographics Similar to Kenyans by Unemployment Among Ages 35 to 44 years
In terms of unemployment among ages 35 to 44 years, the demographic groups most similar to Kenyans are Immigrants from Scotland (4.4%, a difference of 0.050%), Immigrants from Asia (4.4%, a difference of 0.050%), Immigrants from Sweden (4.4%, a difference of 0.070%), Indian (Asian) (4.4%, a difference of 0.12%), and Dutch (4.4%, a difference of 0.18%).
| Demographics | Rating | Rank | Unemployment Among Ages 35 to 44 years |
| Lithuanians | 96.5 /100 | #73 | Exceptional 4.4% |
| Poles | 96.4 /100 | #74 | Exceptional 4.4% |
| Immigrants | Romania | 96.3 /100 | #75 | Exceptional 4.4% |
| Immigrants | Jordan | 96.3 /100 | #76 | Exceptional 4.4% |
| Dutch | 96.1 /100 | #77 | Exceptional 4.4% |
| Indians (Asian) | 96.0 /100 | #78 | Exceptional 4.4% |
| Immigrants | Sweden | 95.9 /100 | #79 | Exceptional 4.4% |
| Kenyans | 95.7 /100 | #80 | Exceptional 4.4% |
| Immigrants | Scotland | 95.6 /100 | #81 | Exceptional 4.4% |
| Immigrants | Asia | 95.6 /100 | #82 | Exceptional 4.4% |
| Immigrants | Australia | 95.3 /100 | #83 | Exceptional 4.4% |
| Immigrants | Chile | 95.2 /100 | #84 | Exceptional 4.4% |
| Immigrants | Kenya | 95.0 /100 | #85 | Exceptional 4.4% |
| Serbians | 94.9 /100 | #86 | Exceptional 4.4% |
| Immigrants | Bosnia and Herzegovina | 94.8 /100 | #87 | Exceptional 4.4% |