Iranian vs Kenyan Poverty
COMPARE
Iranian
Kenyan
Poverty
Poverty Comparison
Iranians
Kenyans
10.7%
POVERTY
99.5/ 100
METRIC RATING
32nd/ 347
METRIC RANK
12.5%
POVERTY
38.8/ 100
METRIC RATING
184th/ 347
METRIC RANK
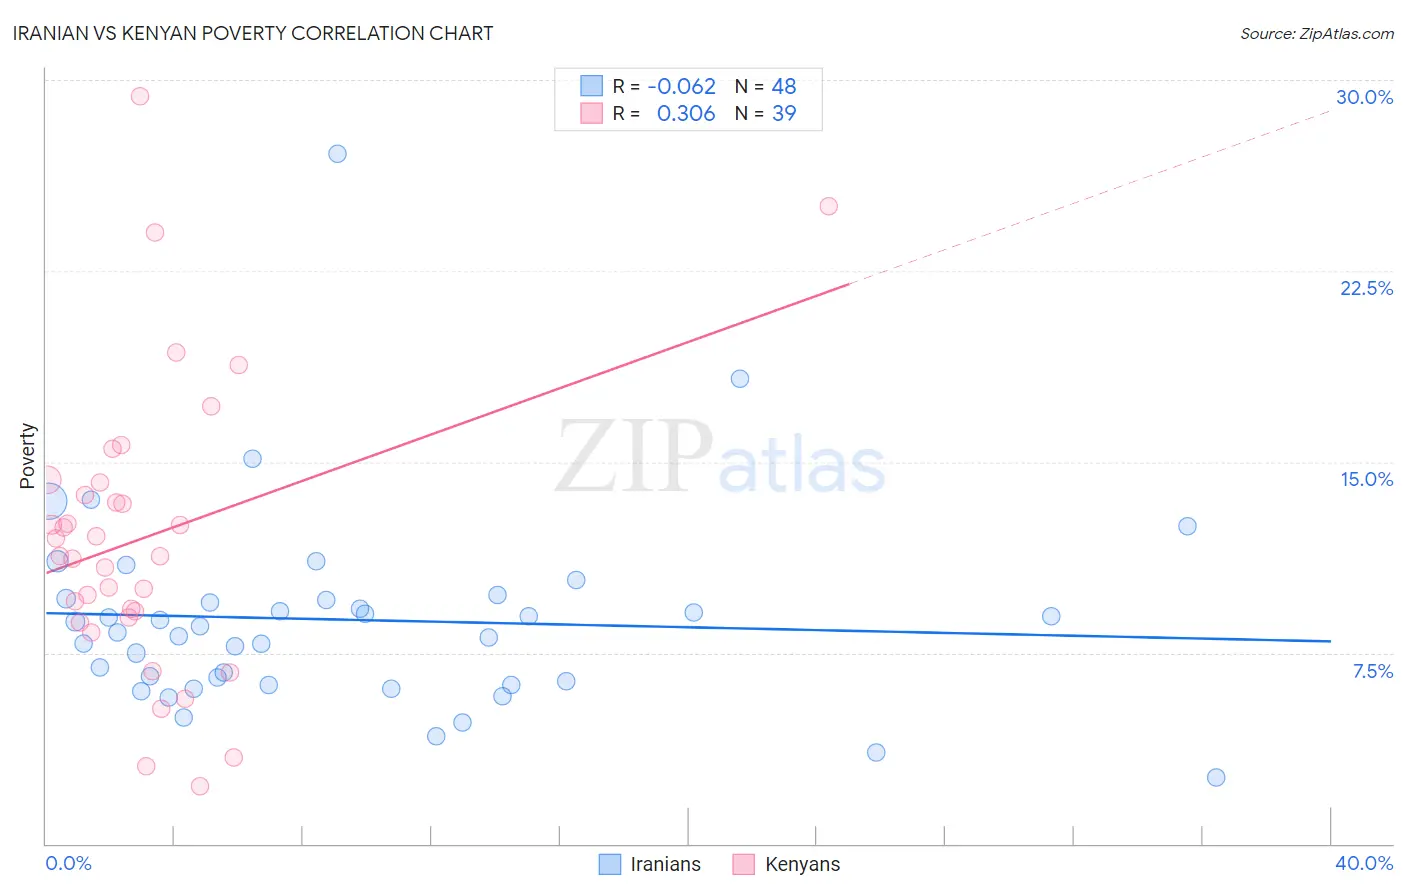
Iranian vs Kenyan Poverty Correlation Chart
The statistical analysis conducted on geographies consisting of 316,670,706 people shows a slight negative correlation between the proportion of Iranians and poverty level in the United States with a correlation coefficient (R) of -0.062 and weighted average of 10.7%. Similarly, the statistical analysis conducted on geographies consisting of 168,174,579 people shows a mild positive correlation between the proportion of Kenyans and poverty level in the United States with a correlation coefficient (R) of 0.306 and weighted average of 12.5%, a difference of 15.9%.
Poverty Correlation Summary
| Measurement | Iranian | Kenyan |
| Minimum | 2.6% | 2.2% |
| Maximum | 27.1% | 29.3% |
| Range | 24.5% | 27.1% |
| Mean | 8.8% | 12.0% |
| Median | 8.4% | 11.3% |
| Interquartile 25% (IQ1) | 6.3% | 8.9% |
| Interquartile 75% (IQ3) | 9.6% | 14.2% |
| Interquartile Range (IQR) | 3.3% | 5.3% |
| Standard Deviation (Sample) | 4.0% | 5.7% |
| Standard Deviation (Population) | 3.9% | 5.7% |
Similar Demographics by Poverty
Demographics Similar to Iranians by Poverty
In terms of poverty, the demographic groups most similar to Iranians are Polish (10.7%, a difference of 0.090%), Danish (10.7%, a difference of 0.17%), Greek (10.7%, a difference of 0.18%), Immigrants from Korea (10.7%, a difference of 0.27%), and Immigrants from Northern Europe (10.7%, a difference of 0.34%).
| Demographics | Rating | Rank | Poverty |
| Croatians | 99.6 /100 | #25 | Exceptional 10.6% |
| Burmese | 99.6 /100 | #26 | Exceptional 10.7% |
| Immigrants | Northern Europe | 99.6 /100 | #27 | Exceptional 10.7% |
| Immigrants | Korea | 99.5 /100 | #28 | Exceptional 10.7% |
| Greeks | 99.5 /100 | #29 | Exceptional 10.7% |
| Danes | 99.5 /100 | #30 | Exceptional 10.7% |
| Poles | 99.5 /100 | #31 | Exceptional 10.7% |
| Iranians | 99.5 /100 | #32 | Exceptional 10.7% |
| Macedonians | 99.4 /100 | #33 | Exceptional 10.8% |
| Immigrants | Poland | 99.4 /100 | #34 | Exceptional 10.8% |
| Tongans | 99.4 /100 | #35 | Exceptional 10.8% |
| Cypriots | 99.3 /100 | #36 | Exceptional 10.8% |
| Immigrants | Greece | 99.3 /100 | #37 | Exceptional 10.8% |
| Czechs | 99.3 /100 | #38 | Exceptional 10.8% |
| Immigrants | Pakistan | 99.3 /100 | #39 | Exceptional 10.8% |
Demographics Similar to Kenyans by Poverty
In terms of poverty, the demographic groups most similar to Kenyans are Immigrants from Iraq (12.4%, a difference of 0.13%), Israeli (12.5%, a difference of 0.24%), Immigrants from Sierra Leone (12.5%, a difference of 0.26%), Immigrants from Cameroon (12.4%, a difference of 0.29%), and Immigrants from Afghanistan (12.4%, a difference of 0.33%).
| Demographics | Rating | Rank | Poverty |
| Immigrants | Syria | 47.5 /100 | #177 | Average 12.3% |
| Uruguayans | 44.7 /100 | #178 | Average 12.4% |
| Immigrants | Morocco | 44.0 /100 | #179 | Average 12.4% |
| Mongolians | 43.6 /100 | #180 | Average 12.4% |
| Immigrants | Afghanistan | 42.1 /100 | #181 | Average 12.4% |
| Immigrants | Cameroon | 41.7 /100 | #182 | Average 12.4% |
| Immigrants | Iraq | 40.2 /100 | #183 | Average 12.4% |
| Kenyans | 38.8 /100 | #184 | Fair 12.5% |
| Israelis | 36.4 /100 | #185 | Fair 12.5% |
| Immigrants | Sierra Leone | 36.3 /100 | #186 | Fair 12.5% |
| Hawaiians | 34.1 /100 | #187 | Fair 12.5% |
| Immigrants | Costa Rica | 33.3 /100 | #188 | Fair 12.5% |
| Aleuts | 33.2 /100 | #189 | Fair 12.5% |
| Immigrants | South America | 32.3 /100 | #190 | Fair 12.5% |
| Sierra Leoneans | 31.5 /100 | #191 | Fair 12.6% |