Hmong vs Kenyan Poverty
COMPARE
Hmong
Kenyan
Poverty
Poverty Comparison
Hmong
Kenyans
12.8%
POVERTY
15.0/ 100
METRIC RATING
203rd/ 347
METRIC RANK
12.5%
POVERTY
38.8/ 100
METRIC RATING
184th/ 347
METRIC RANK
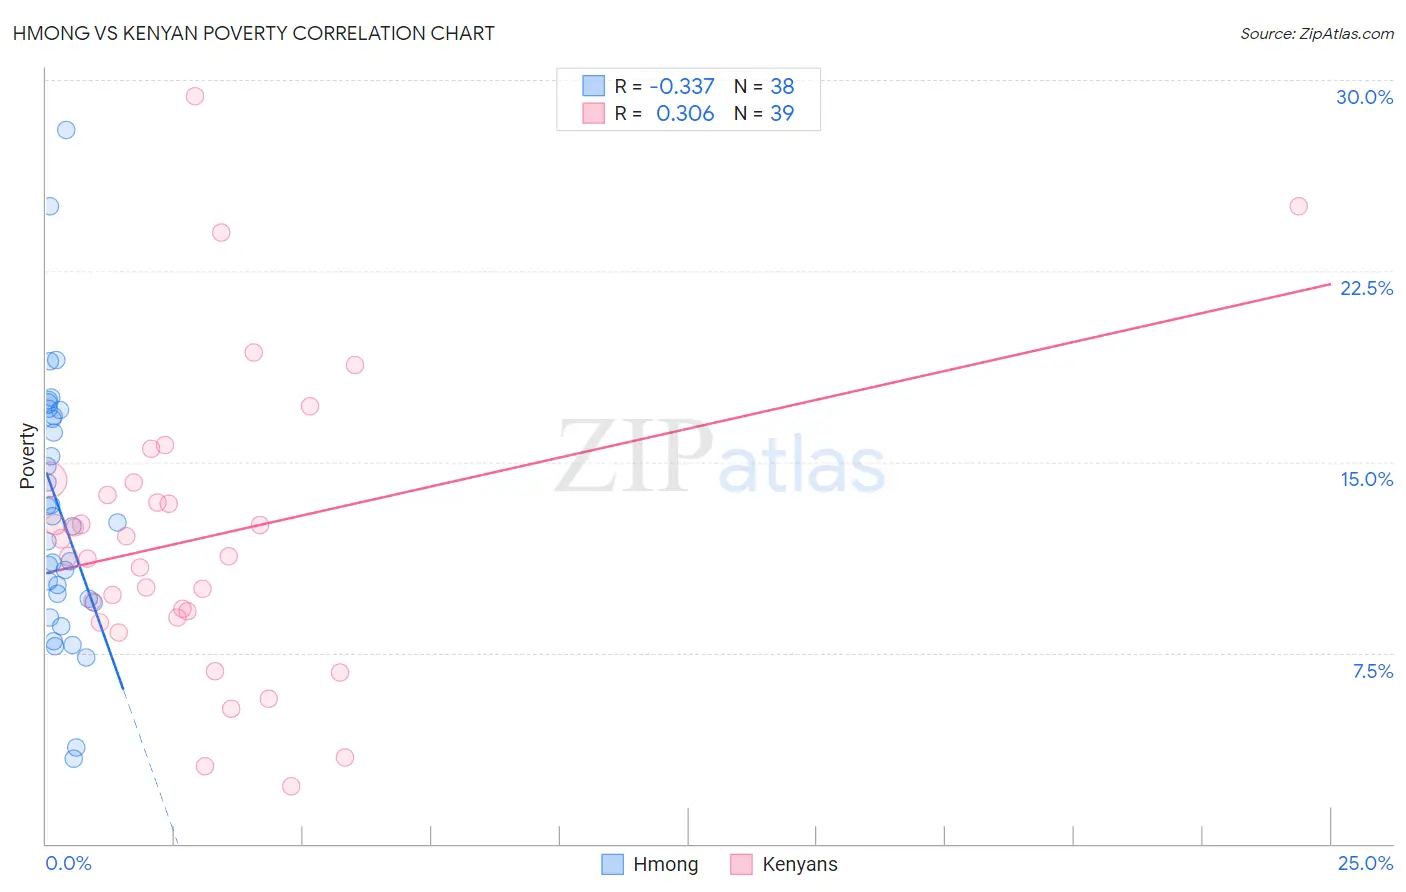
Hmong vs Kenyan Poverty Correlation Chart
The statistical analysis conducted on geographies consisting of 24,672,093 people shows a mild negative correlation between the proportion of Hmong and poverty level in the United States with a correlation coefficient (R) of -0.337 and weighted average of 12.8%. Similarly, the statistical analysis conducted on geographies consisting of 168,174,579 people shows a mild positive correlation between the proportion of Kenyans and poverty level in the United States with a correlation coefficient (R) of 0.306 and weighted average of 12.5%, a difference of 3.1%.
Poverty Correlation Summary
| Measurement | Hmong | Kenyan |
| Minimum | 3.3% | 2.2% |
| Maximum | 28.0% | 29.3% |
| Range | 24.7% | 27.1% |
| Mean | 13.1% | 12.0% |
| Median | 12.5% | 11.3% |
| Interquartile 25% (IQ1) | 9.6% | 8.9% |
| Interquartile 75% (IQ3) | 16.8% | 14.2% |
| Interquartile Range (IQR) | 7.2% | 5.3% |
| Standard Deviation (Sample) | 5.1% | 5.7% |
| Standard Deviation (Population) | 5.1% | 5.7% |
Demographics Similar to Hmong and Kenyans by Poverty
In terms of poverty, the demographic groups most similar to Hmong are Immigrants from Uruguay (12.8%, a difference of 0.10%), Immigrants from Uganda (12.8%, a difference of 0.26%), Spaniard (12.8%, a difference of 0.27%), Immigrants from Kenya (12.8%, a difference of 0.42%), and Spanish (12.8%, a difference of 0.61%). Similarly, the demographic groups most similar to Kenyans are Immigrants from Iraq (12.4%, a difference of 0.13%), Israeli (12.5%, a difference of 0.24%), Immigrants from Sierra Leone (12.5%, a difference of 0.26%), Hawaiian (12.5%, a difference of 0.49%), and Immigrants from Costa Rica (12.5%, a difference of 0.58%).
| Demographics | Rating | Rank | Poverty |
| Immigrants | Iraq | 40.2 /100 | #183 | Average 12.4% |
| Kenyans | 38.8 /100 | #184 | Fair 12.5% |
| Israelis | 36.4 /100 | #185 | Fair 12.5% |
| Immigrants | Sierra Leone | 36.3 /100 | #186 | Fair 12.5% |
| Hawaiians | 34.1 /100 | #187 | Fair 12.5% |
| Immigrants | Costa Rica | 33.3 /100 | #188 | Fair 12.5% |
| Aleuts | 33.2 /100 | #189 | Fair 12.5% |
| Immigrants | South America | 32.3 /100 | #190 | Fair 12.5% |
| Sierra Leoneans | 31.5 /100 | #191 | Fair 12.6% |
| South American Indians | 23.3 /100 | #192 | Fair 12.7% |
| Delaware | 21.4 /100 | #193 | Fair 12.7% |
| Arabs | 21.1 /100 | #194 | Fair 12.7% |
| Immigrants | Kuwait | 20.9 /100 | #195 | Fair 12.7% |
| Iraqis | 20.8 /100 | #196 | Fair 12.7% |
| Immigrants | Lebanon | 18.7 /100 | #197 | Poor 12.8% |
| Spanish | 18.7 /100 | #198 | Poor 12.8% |
| Immigrants | Kenya | 17.5 /100 | #199 | Poor 12.8% |
| Spaniards | 16.5 /100 | #200 | Poor 12.8% |
| Immigrants | Uganda | 16.5 /100 | #201 | Poor 12.8% |
| Immigrants | Uruguay | 15.6 /100 | #202 | Poor 12.8% |
| Hmong | 15.0 /100 | #203 | Poor 12.8% |