Immigrants from Cuba vs Immigrants from Guatemala Poverty
COMPARE
Immigrants from Cuba
Immigrants from Guatemala
Poverty
Poverty Comparison
Immigrants from Cuba
Immigrants from Guatemala
14.6%
POVERTY
0.1/ 100
METRIC RATING
269th/ 347
METRIC RANK
15.5%
POVERTY
0.0/ 100
METRIC RATING
305th/ 347
METRIC RANK
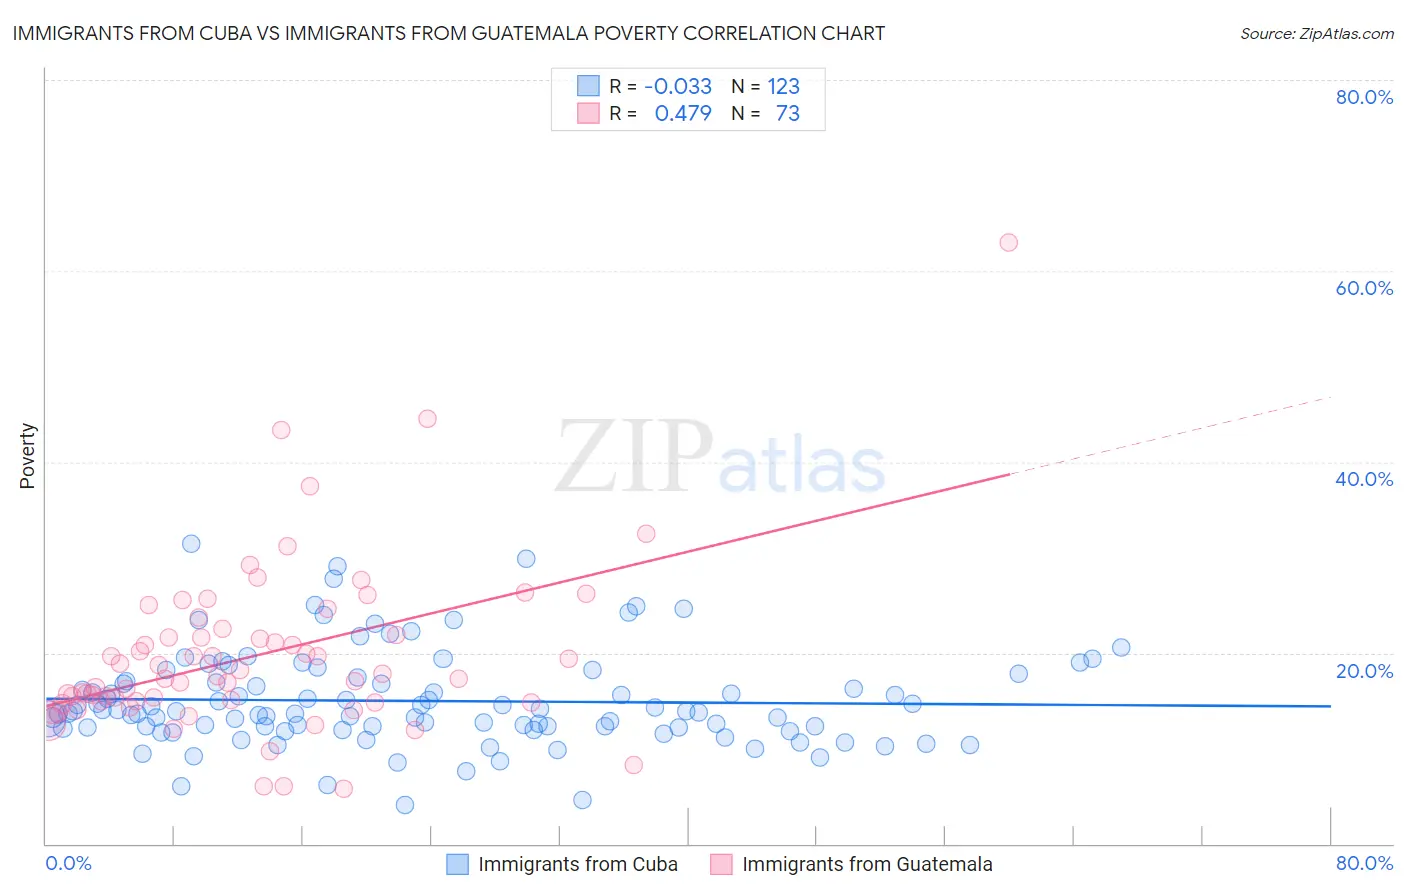
Immigrants from Cuba vs Immigrants from Guatemala Poverty Correlation Chart
The statistical analysis conducted on geographies consisting of 325,967,480 people shows no correlation between the proportion of Immigrants from Cuba and poverty level in the United States with a correlation coefficient (R) of -0.033 and weighted average of 14.6%. Similarly, the statistical analysis conducted on geographies consisting of 377,145,894 people shows a moderate positive correlation between the proportion of Immigrants from Guatemala and poverty level in the United States with a correlation coefficient (R) of 0.479 and weighted average of 15.5%, a difference of 6.5%.
Poverty Correlation Summary
| Measurement | Immigrants from Cuba | Immigrants from Guatemala |
| Minimum | 4.1% | 5.8% |
| Maximum | 31.4% | 62.9% |
| Range | 27.3% | 57.2% |
| Mean | 15.0% | 19.7% |
| Median | 13.9% | 17.5% |
| Interquartile 25% (IQ1) | 12.2% | 14.8% |
| Interquartile 75% (IQ3) | 17.1% | 22.2% |
| Interquartile Range (IQR) | 4.9% | 7.3% |
| Standard Deviation (Sample) | 5.0% | 8.9% |
| Standard Deviation (Population) | 5.0% | 8.9% |
Similar Demographics by Poverty
Demographics Similar to Immigrants from Cuba by Poverty
In terms of poverty, the demographic groups most similar to Immigrants from Cuba are Central American (14.6%, a difference of 0.14%), Subsaharan African (14.5%, a difference of 0.15%), Iroquois (14.5%, a difference of 0.19%), Guyanese (14.5%, a difference of 0.51%), and Immigrants from Guyana (14.5%, a difference of 0.68%).
| Demographics | Rating | Rank | Poverty |
| Immigrants | Liberia | 0.1 /100 | #262 | Tragic 14.4% |
| Jamaicans | 0.1 /100 | #263 | Tragic 14.4% |
| Immigrants | Jamaica | 0.1 /100 | #264 | Tragic 14.4% |
| Immigrants | Guyana | 0.1 /100 | #265 | Tragic 14.5% |
| Guyanese | 0.1 /100 | #266 | Tragic 14.5% |
| Iroquois | 0.1 /100 | #267 | Tragic 14.5% |
| Sub-Saharan Africans | 0.1 /100 | #268 | Tragic 14.5% |
| Immigrants | Cuba | 0.1 /100 | #269 | Tragic 14.6% |
| Central Americans | 0.1 /100 | #270 | Tragic 14.6% |
| Shoshone | 0.0 /100 | #271 | Tragic 14.7% |
| Chickasaw | 0.0 /100 | #272 | Tragic 14.7% |
| Spanish Americans | 0.0 /100 | #273 | Tragic 14.7% |
| Barbadians | 0.0 /100 | #274 | Tragic 14.8% |
| Immigrants | West Indies | 0.0 /100 | #275 | Tragic 14.8% |
| Immigrants | Bahamas | 0.0 /100 | #276 | Tragic 14.8% |
Demographics Similar to Immigrants from Guatemala by Poverty
In terms of poverty, the demographic groups most similar to Immigrants from Guatemala are Immigrants from Mexico (15.5%, a difference of 0.030%), Immigrants from Caribbean (15.5%, a difference of 0.12%), Creek (15.6%, a difference of 0.44%), African (15.6%, a difference of 0.51%), and Somali (15.4%, a difference of 0.61%).
| Demographics | Rating | Rank | Poverty |
| Immigrants | Senegal | 0.0 /100 | #298 | Tragic 15.3% |
| Senegalese | 0.0 /100 | #299 | Tragic 15.3% |
| Immigrants | Central America | 0.0 /100 | #300 | Tragic 15.4% |
| Bahamians | 0.0 /100 | #301 | Tragic 15.4% |
| Somalis | 0.0 /100 | #302 | Tragic 15.4% |
| Immigrants | Caribbean | 0.0 /100 | #303 | Tragic 15.5% |
| Immigrants | Mexico | 0.0 /100 | #304 | Tragic 15.5% |
| Immigrants | Guatemala | 0.0 /100 | #305 | Tragic 15.5% |
| Creek | 0.0 /100 | #306 | Tragic 15.6% |
| Africans | 0.0 /100 | #307 | Tragic 15.6% |
| Choctaw | 0.0 /100 | #308 | Tragic 15.6% |
| Seminole | 0.0 /100 | #309 | Tragic 15.6% |
| Dutch West Indians | 0.0 /100 | #310 | Tragic 15.6% |
| Chippewa | 0.0 /100 | #311 | Tragic 15.7% |
| Cajuns | 0.0 /100 | #312 | Tragic 15.7% |