Navajo vs Immigrants from Taiwan Single Mother Poverty
COMPARE
Navajo
Immigrants from Taiwan
Single Mother Poverty
Single Mother Poverty Comparison
Navajo
Immigrants from Taiwan
40.2%
SINGLE MOTHER POVERTY
0.0/ 100
METRIC RATING
342nd/ 347
METRIC RANK
23.9%
SINGLE MOTHER POVERTY
100.0/ 100
METRIC RATING
3rd/ 347
METRIC RANK
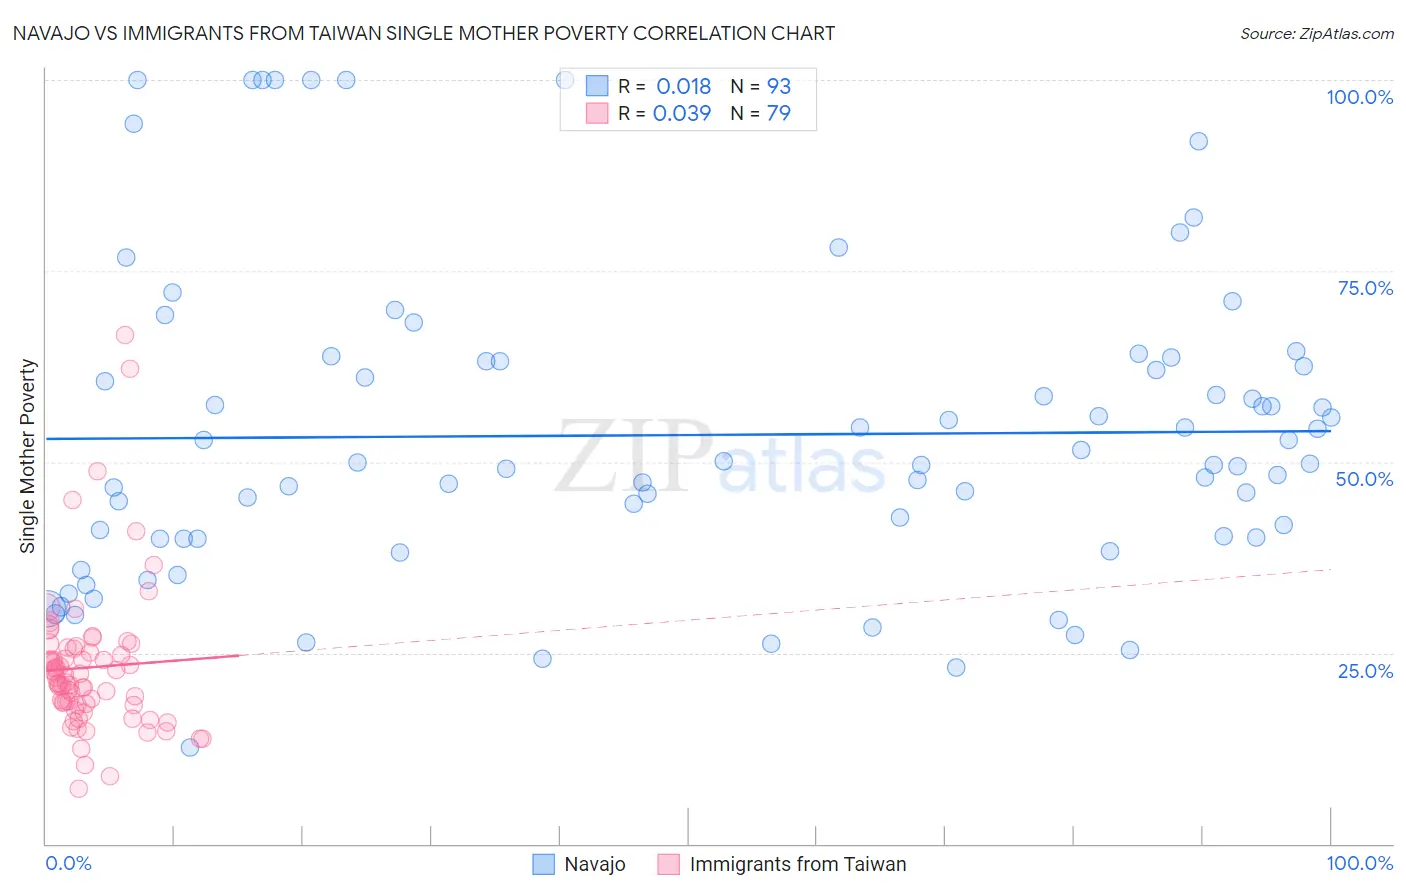
Navajo vs Immigrants from Taiwan Single Mother Poverty Correlation Chart
The statistical analysis conducted on geographies consisting of 222,508,817 people shows no correlation between the proportion of Navajo and poverty level among single mothers in the United States with a correlation coefficient (R) of 0.018 and weighted average of 40.2%. Similarly, the statistical analysis conducted on geographies consisting of 291,292,084 people shows no correlation between the proportion of Immigrants from Taiwan and poverty level among single mothers in the United States with a correlation coefficient (R) of 0.039 and weighted average of 23.9%, a difference of 68.6%.
Single Mother Poverty Correlation Summary
| Measurement | Navajo | Immigrants from Taiwan |
| Minimum | 12.6% | 7.2% |
| Maximum | 100.0% | 66.7% |
| Range | 87.4% | 59.4% |
| Mean | 53.5% | 23.1% |
| Median | 49.8% | 21.1% |
| Interquartile 25% (IQ1) | 40.0% | 18.2% |
| Interquartile 75% (IQ3) | 63.1% | 25.5% |
| Interquartile Range (IQR) | 23.1% | 7.3% |
| Standard Deviation (Sample) | 20.3% | 9.7% |
| Standard Deviation (Population) | 20.2% | 9.6% |
Similar Demographics by Single Mother Poverty
Demographics Similar to Navajo by Single Mother Poverty
In terms of single mother poverty, the demographic groups most similar to Navajo are Cajun (40.3%, a difference of 0.33%), Colville (39.3%, a difference of 2.4%), Sioux (38.8%, a difference of 3.7%), Crow (38.6%, a difference of 4.1%), and Pima (38.6%, a difference of 4.2%).
| Demographics | Rating | Rank | Single Mother Poverty |
| Menominee | 0.0 /100 | #333 | Tragic 37.1% |
| Pueblo | 0.0 /100 | #334 | Tragic 37.2% |
| Yuman | 0.0 /100 | #335 | Tragic 37.8% |
| Cheyenne | 0.0 /100 | #336 | Tragic 38.5% |
| Immigrants | Yemen | 0.0 /100 | #337 | Tragic 38.5% |
| Pima | 0.0 /100 | #338 | Tragic 38.6% |
| Crow | 0.0 /100 | #339 | Tragic 38.6% |
| Sioux | 0.0 /100 | #340 | Tragic 38.8% |
| Colville | 0.0 /100 | #341 | Tragic 39.3% |
| Navajo | 0.0 /100 | #342 | Tragic 40.2% |
| Cajuns | 0.0 /100 | #343 | Tragic 40.3% |
| Tohono O'odham | 0.0 /100 | #344 | Tragic 43.0% |
| Lumbee | 0.0 /100 | #345 | Tragic 43.2% |
| Houma | 0.0 /100 | #346 | Tragic 43.5% |
| Puerto Ricans | 0.0 /100 | #347 | Tragic 44.5% |
Demographics Similar to Immigrants from Taiwan by Single Mother Poverty
In terms of single mother poverty, the demographic groups most similar to Immigrants from Taiwan are Immigrants from India (23.8%, a difference of 0.20%), Assyrian/Chaldean/Syriac (23.8%, a difference of 0.21%), Filipino (24.3%, a difference of 1.9%), Immigrants from Hong Kong (24.4%, a difference of 2.1%), and Thai (24.5%, a difference of 2.7%).
| Demographics | Rating | Rank | Single Mother Poverty |
| Assyrians/Chaldeans/Syriacs | 100.0 /100 | #1 | Exceptional 23.8% |
| Immigrants | India | 100.0 /100 | #2 | Exceptional 23.8% |
| Immigrants | Taiwan | 100.0 /100 | #3 | Exceptional 23.9% |
| Filipinos | 100.0 /100 | #4 | Exceptional 24.3% |
| Immigrants | Hong Kong | 100.0 /100 | #5 | Exceptional 24.4% |
| Thais | 100.0 /100 | #6 | Exceptional 24.5% |
| Chinese | 100.0 /100 | #7 | Exceptional 24.6% |
| Immigrants | Iran | 100.0 /100 | #8 | Exceptional 25.1% |
| Immigrants | Lithuania | 100.0 /100 | #9 | Exceptional 25.2% |
| Immigrants | South Central Asia | 100.0 /100 | #10 | Exceptional 25.3% |
| Iranians | 100.0 /100 | #11 | Exceptional 25.5% |
| Bhutanese | 100.0 /100 | #12 | Exceptional 25.6% |
| Indians (Asian) | 100.0 /100 | #13 | Exceptional 25.8% |
| Immigrants | Singapore | 100.0 /100 | #14 | Exceptional 25.8% |
| Immigrants | Ireland | 100.0 /100 | #15 | Exceptional 25.8% |