Navajo vs Tohono O'odham Single Mother Poverty
COMPARE
Navajo
Tohono O'odham
Single Mother Poverty
Single Mother Poverty Comparison
Navajo
Tohono O'odham
40.2%
SINGLE MOTHER POVERTY
0.0/ 100
METRIC RATING
342nd/ 347
METRIC RANK
43.0%
SINGLE MOTHER POVERTY
0.0/ 100
METRIC RATING
344th/ 347
METRIC RANK
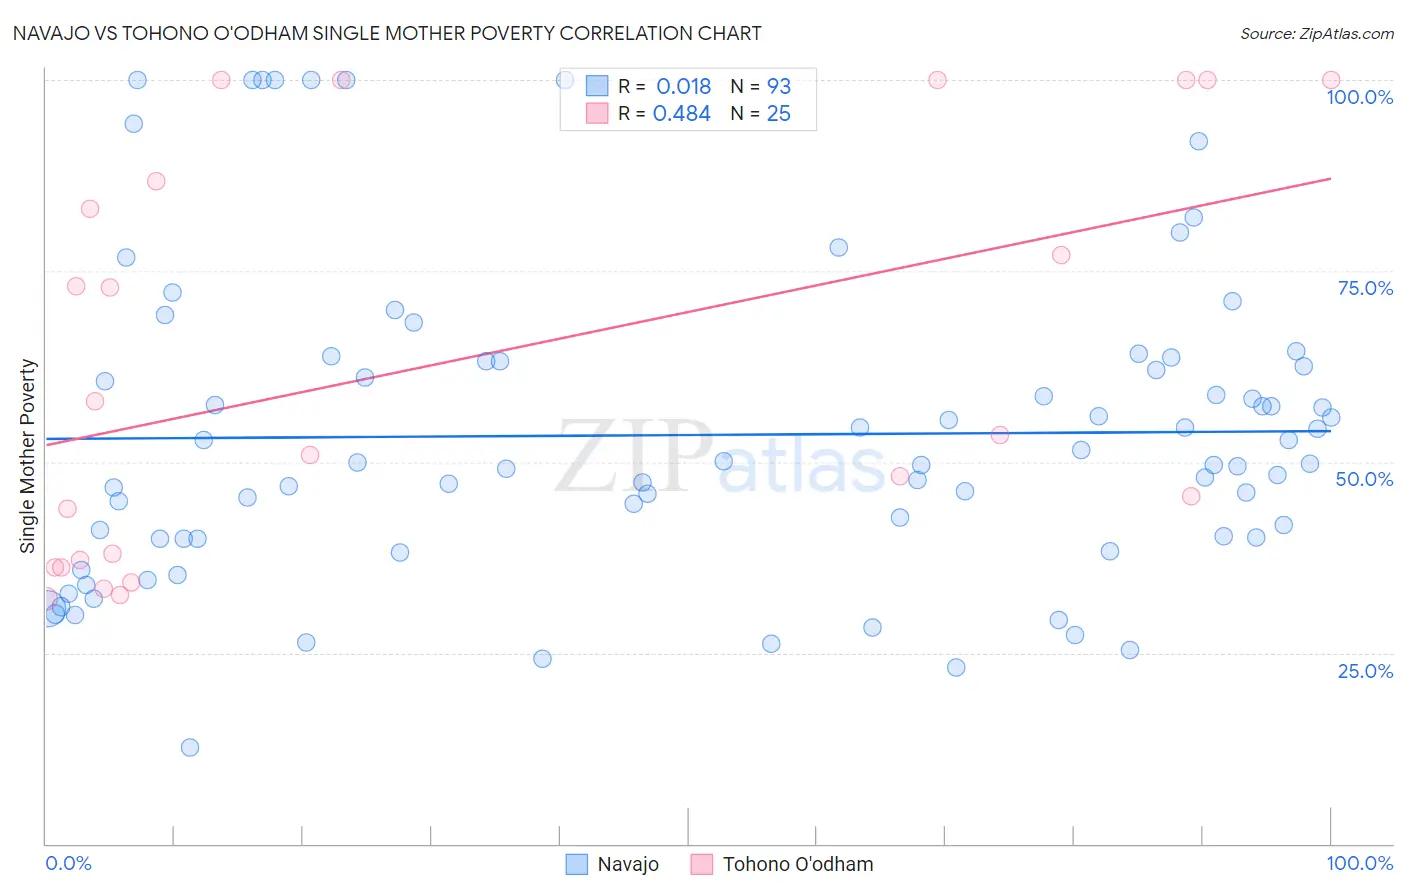
Navajo vs Tohono O'odham Single Mother Poverty Correlation Chart
The statistical analysis conducted on geographies consisting of 222,508,817 people shows no correlation between the proportion of Navajo and poverty level among single mothers in the United States with a correlation coefficient (R) of 0.018 and weighted average of 40.2%. Similarly, the statistical analysis conducted on geographies consisting of 58,556,531 people shows a moderate positive correlation between the proportion of Tohono O'odham and poverty level among single mothers in the United States with a correlation coefficient (R) of 0.484 and weighted average of 43.0%, a difference of 7.0%.
Single Mother Poverty Correlation Summary
| Measurement | Navajo | Tohono O'odham |
| Minimum | 12.6% | 32.1% |
| Maximum | 100.0% | 100.0% |
| Range | 87.4% | 67.9% |
| Mean | 53.5% | 62.9% |
| Median | 49.8% | 53.5% |
| Interquartile 25% (IQ1) | 40.0% | 36.6% |
| Interquartile 75% (IQ3) | 63.1% | 93.4% |
| Interquartile Range (IQR) | 23.1% | 56.8% |
| Standard Deviation (Sample) | 20.3% | 26.7% |
| Standard Deviation (Population) | 20.2% | 26.1% |
Demographics Similar to Navajo and Tohono O'odham by Single Mother Poverty
In terms of single mother poverty, the demographic groups most similar to Navajo are Cajun (40.3%, a difference of 0.33%), Colville (39.3%, a difference of 2.4%), Sioux (38.8%, a difference of 3.7%), Crow (38.6%, a difference of 4.1%), and Pima (38.6%, a difference of 4.2%). Similarly, the demographic groups most similar to Tohono O'odham are Lumbee (43.2%, a difference of 0.49%), Houma (43.5%, a difference of 1.1%), Puerto Rican (44.5%, a difference of 3.5%), Cajun (40.3%, a difference of 6.7%), and Colville (39.3%, a difference of 9.5%).
| Demographics | Rating | Rank | Single Mother Poverty |
| Choctaw | 0.0 /100 | #328 | Tragic 36.4% |
| Apache | 0.0 /100 | #329 | Tragic 36.6% |
| Natives/Alaskans | 0.0 /100 | #330 | Tragic 36.6% |
| Creek | 0.0 /100 | #331 | Tragic 36.7% |
| Dutch West Indians | 0.0 /100 | #332 | Tragic 36.8% |
| Menominee | 0.0 /100 | #333 | Tragic 37.1% |
| Pueblo | 0.0 /100 | #334 | Tragic 37.2% |
| Yuman | 0.0 /100 | #335 | Tragic 37.8% |
| Cheyenne | 0.0 /100 | #336 | Tragic 38.5% |
| Immigrants | Yemen | 0.0 /100 | #337 | Tragic 38.5% |
| Pima | 0.0 /100 | #338 | Tragic 38.6% |
| Crow | 0.0 /100 | #339 | Tragic 38.6% |
| Sioux | 0.0 /100 | #340 | Tragic 38.8% |
| Colville | 0.0 /100 | #341 | Tragic 39.3% |
| Navajo | 0.0 /100 | #342 | Tragic 40.2% |
| Cajuns | 0.0 /100 | #343 | Tragic 40.3% |
| Tohono O'odham | 0.0 /100 | #344 | Tragic 43.0% |
| Lumbee | 0.0 /100 | #345 | Tragic 43.2% |
| Houma | 0.0 /100 | #346 | Tragic 43.5% |
| Puerto Ricans | 0.0 /100 | #347 | Tragic 44.5% |