Navajo vs Guamanian/Chamorro Single Mother Poverty
COMPARE
Navajo
Guamanian/Chamorro
Single Mother Poverty
Single Mother Poverty Comparison
Navajo
Guamanians/Chamorros
40.2%
SINGLE MOTHER POVERTY
0.0/ 100
METRIC RATING
342nd/ 347
METRIC RANK
29.4%
SINGLE MOTHER POVERTY
31.8/ 100
METRIC RATING
188th/ 347
METRIC RANK
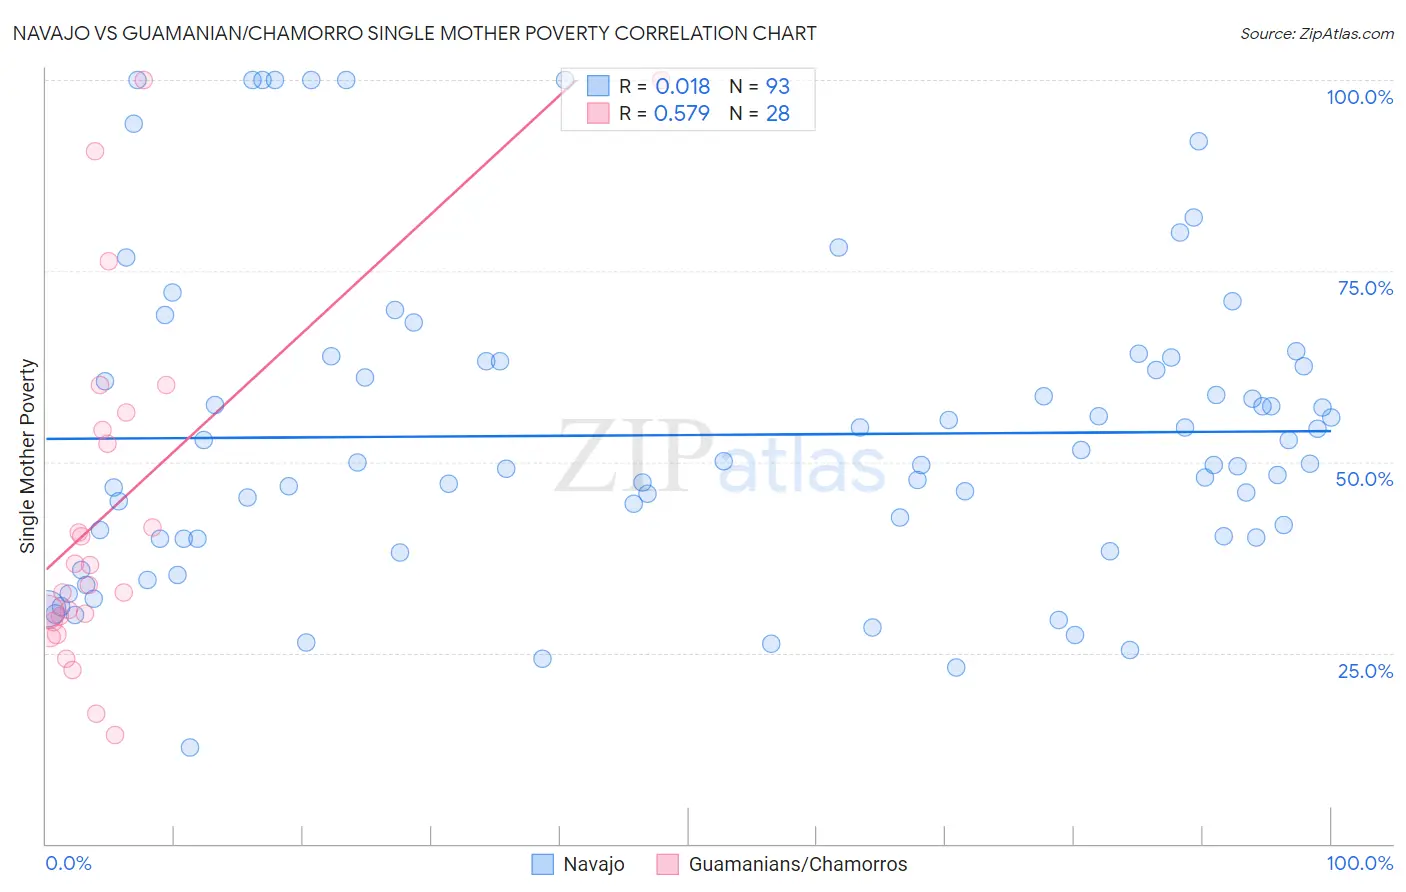
Navajo vs Guamanian/Chamorro Single Mother Poverty Correlation Chart
The statistical analysis conducted on geographies consisting of 222,508,817 people shows no correlation between the proportion of Navajo and poverty level among single mothers in the United States with a correlation coefficient (R) of 0.018 and weighted average of 40.2%. Similarly, the statistical analysis conducted on geographies consisting of 219,675,506 people shows a substantial positive correlation between the proportion of Guamanians/Chamorros and poverty level among single mothers in the United States with a correlation coefficient (R) of 0.579 and weighted average of 29.4%, a difference of 36.6%.
Single Mother Poverty Correlation Summary
| Measurement | Navajo | Guamanian/Chamorro |
| Minimum | 12.6% | 14.3% |
| Maximum | 100.0% | 100.0% |
| Range | 87.4% | 85.7% |
| Mean | 53.5% | 43.9% |
| Median | 49.8% | 35.2% |
| Interquartile 25% (IQ1) | 40.0% | 29.4% |
| Interquartile 75% (IQ3) | 63.1% | 55.3% |
| Interquartile Range (IQR) | 23.1% | 25.8% |
| Standard Deviation (Sample) | 20.3% | 23.4% |
| Standard Deviation (Population) | 20.2% | 23.0% |
Similar Demographics by Single Mother Poverty
Demographics Similar to Navajo by Single Mother Poverty
In terms of single mother poverty, the demographic groups most similar to Navajo are Cajun (40.3%, a difference of 0.33%), Colville (39.3%, a difference of 2.4%), Sioux (38.8%, a difference of 3.7%), Crow (38.6%, a difference of 4.1%), and Pima (38.6%, a difference of 4.2%).
| Demographics | Rating | Rank | Single Mother Poverty |
| Menominee | 0.0 /100 | #333 | Tragic 37.1% |
| Pueblo | 0.0 /100 | #334 | Tragic 37.2% |
| Yuman | 0.0 /100 | #335 | Tragic 37.8% |
| Cheyenne | 0.0 /100 | #336 | Tragic 38.5% |
| Immigrants | Yemen | 0.0 /100 | #337 | Tragic 38.5% |
| Pima | 0.0 /100 | #338 | Tragic 38.6% |
| Crow | 0.0 /100 | #339 | Tragic 38.6% |
| Sioux | 0.0 /100 | #340 | Tragic 38.8% |
| Colville | 0.0 /100 | #341 | Tragic 39.3% |
| Navajo | 0.0 /100 | #342 | Tragic 40.2% |
| Cajuns | 0.0 /100 | #343 | Tragic 40.3% |
| Tohono O'odham | 0.0 /100 | #344 | Tragic 43.0% |
| Lumbee | 0.0 /100 | #345 | Tragic 43.2% |
| Houma | 0.0 /100 | #346 | Tragic 43.5% |
| Puerto Ricans | 0.0 /100 | #347 | Tragic 44.5% |
Demographics Similar to Guamanians/Chamorros by Single Mother Poverty
In terms of single mother poverty, the demographic groups most similar to Guamanians/Chamorros are Immigrants from Africa (29.4%, a difference of 0.010%), Lebanese (29.4%, a difference of 0.040%), Immigrants from Germany (29.5%, a difference of 0.070%), Immigrants from Trinidad and Tobago (29.5%, a difference of 0.14%), and Moroccan (29.5%, a difference of 0.18%).
| Demographics | Rating | Rank | Single Mother Poverty |
| Canadians | 40.4 /100 | #181 | Average 29.3% |
| Immigrants | Eastern Africa | 38.5 /100 | #182 | Fair 29.3% |
| Nepalese | 38.3 /100 | #183 | Fair 29.3% |
| Nigerians | 38.0 /100 | #184 | Fair 29.3% |
| Ghanaians | 36.8 /100 | #185 | Fair 29.4% |
| Yugoslavians | 36.0 /100 | #186 | Fair 29.4% |
| Lebanese | 32.5 /100 | #187 | Fair 29.4% |
| Guamanians/Chamorros | 31.8 /100 | #188 | Fair 29.4% |
| Immigrants | Africa | 31.6 /100 | #189 | Fair 29.4% |
| Immigrants | Germany | 30.4 /100 | #190 | Fair 29.5% |
| Immigrants | Trinidad and Tobago | 29.2 /100 | #191 | Fair 29.5% |
| Moroccans | 28.6 /100 | #192 | Fair 29.5% |
| Basques | 28.3 /100 | #193 | Fair 29.5% |
| Icelanders | 26.1 /100 | #194 | Fair 29.5% |
| Slavs | 24.5 /100 | #195 | Fair 29.6% |