Immigrants from Zaire vs Immigrants from Taiwan Single Mother Poverty
COMPARE
Immigrants from Zaire
Immigrants from Taiwan
Single Mother Poverty
Single Mother Poverty Comparison
Immigrants from Zaire
Immigrants from Taiwan
32.0%
SINGLE MOTHER POVERTY
0.0/ 100
METRIC RATING
278th/ 347
METRIC RANK
23.9%
SINGLE MOTHER POVERTY
100.0/ 100
METRIC RATING
3rd/ 347
METRIC RANK
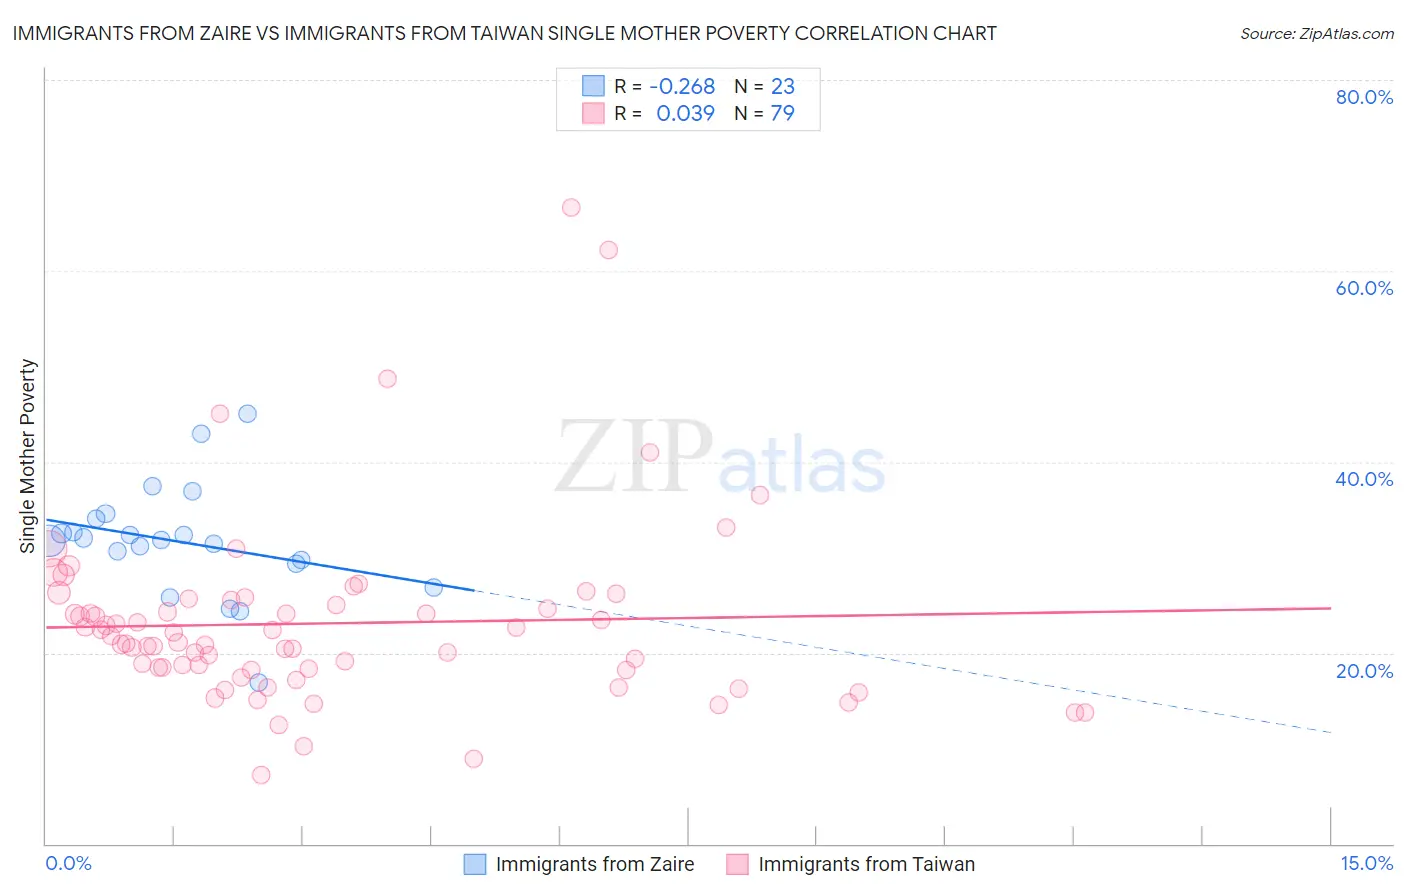
Immigrants from Zaire vs Immigrants from Taiwan Single Mother Poverty Correlation Chart
The statistical analysis conducted on geographies consisting of 106,703,532 people shows a weak negative correlation between the proportion of Immigrants from Zaire and poverty level among single mothers in the United States with a correlation coefficient (R) of -0.268 and weighted average of 32.0%. Similarly, the statistical analysis conducted on geographies consisting of 291,292,084 people shows no correlation between the proportion of Immigrants from Taiwan and poverty level among single mothers in the United States with a correlation coefficient (R) of 0.039 and weighted average of 23.9%, a difference of 34.0%.
Single Mother Poverty Correlation Summary
| Measurement | Immigrants from Zaire | Immigrants from Taiwan |
| Minimum | 16.9% | 7.2% |
| Maximum | 45.1% | 66.7% |
| Range | 28.2% | 59.4% |
| Mean | 31.6% | 23.1% |
| Median | 31.9% | 21.1% |
| Interquartile 25% (IQ1) | 29.4% | 18.2% |
| Interquartile 75% (IQ3) | 34.1% | 25.5% |
| Interquartile Range (IQR) | 4.7% | 7.3% |
| Standard Deviation (Sample) | 5.9% | 9.7% |
| Standard Deviation (Population) | 5.8% | 9.6% |
Similar Demographics by Single Mother Poverty
Demographics Similar to Immigrants from Zaire by Single Mother Poverty
In terms of single mother poverty, the demographic groups most similar to Immigrants from Zaire are Mexican American Indian (31.9%, a difference of 0.22%), Marshallese (32.1%, a difference of 0.40%), Delaware (31.8%, a difference of 0.43%), Central American (31.8%, a difference of 0.60%), and Nonimmigrants (32.2%, a difference of 0.62%).
| Demographics | Rating | Rank | Single Mother Poverty |
| Immigrants | Cabo Verde | 0.1 /100 | #271 | Tragic 31.6% |
| Immigrants | Micronesia | 0.1 /100 | #272 | Tragic 31.6% |
| Fijians | 0.1 /100 | #273 | Tragic 31.6% |
| Bangladeshis | 0.1 /100 | #274 | Tragic 31.7% |
| Central Americans | 0.1 /100 | #275 | Tragic 31.8% |
| Delaware | 0.0 /100 | #276 | Tragic 31.8% |
| Mexican American Indians | 0.0 /100 | #277 | Tragic 31.9% |
| Immigrants | Zaire | 0.0 /100 | #278 | Tragic 32.0% |
| Marshallese | 0.0 /100 | #279 | Tragic 32.1% |
| Immigrants | Nonimmigrants | 0.0 /100 | #280 | Tragic 32.2% |
| Cree | 0.0 /100 | #281 | Tragic 32.2% |
| Immigrants | Azores | 0.0 /100 | #282 | Tragic 32.2% |
| Spanish Americans | 0.0 /100 | #283 | Tragic 32.3% |
| Indonesians | 0.0 /100 | #284 | Tragic 32.4% |
| Immigrants | Latin America | 0.0 /100 | #285 | Tragic 32.4% |
Demographics Similar to Immigrants from Taiwan by Single Mother Poverty
In terms of single mother poverty, the demographic groups most similar to Immigrants from Taiwan are Immigrants from India (23.8%, a difference of 0.20%), Assyrian/Chaldean/Syriac (23.8%, a difference of 0.21%), Filipino (24.3%, a difference of 1.9%), Immigrants from Hong Kong (24.4%, a difference of 2.1%), and Thai (24.5%, a difference of 2.7%).
| Demographics | Rating | Rank | Single Mother Poverty |
| Assyrians/Chaldeans/Syriacs | 100.0 /100 | #1 | Exceptional 23.8% |
| Immigrants | India | 100.0 /100 | #2 | Exceptional 23.8% |
| Immigrants | Taiwan | 100.0 /100 | #3 | Exceptional 23.9% |
| Filipinos | 100.0 /100 | #4 | Exceptional 24.3% |
| Immigrants | Hong Kong | 100.0 /100 | #5 | Exceptional 24.4% |
| Thais | 100.0 /100 | #6 | Exceptional 24.5% |
| Chinese | 100.0 /100 | #7 | Exceptional 24.6% |
| Immigrants | Iran | 100.0 /100 | #8 | Exceptional 25.1% |
| Immigrants | Lithuania | 100.0 /100 | #9 | Exceptional 25.2% |
| Immigrants | South Central Asia | 100.0 /100 | #10 | Exceptional 25.3% |
| Iranians | 100.0 /100 | #11 | Exceptional 25.5% |
| Bhutanese | 100.0 /100 | #12 | Exceptional 25.6% |
| Indians (Asian) | 100.0 /100 | #13 | Exceptional 25.8% |
| Immigrants | Singapore | 100.0 /100 | #14 | Exceptional 25.8% |
| Immigrants | Ireland | 100.0 /100 | #15 | Exceptional 25.8% |