Burmese vs Immigrants from Taiwan Single Mother Poverty
COMPARE
Burmese
Immigrants from Taiwan
Single Mother Poverty
Single Mother Poverty Comparison
Burmese
Immigrants from Taiwan
26.2%
SINGLE MOTHER POVERTY
100.0/ 100
METRIC RATING
23rd/ 347
METRIC RANK
23.9%
SINGLE MOTHER POVERTY
100.0/ 100
METRIC RATING
3rd/ 347
METRIC RANK
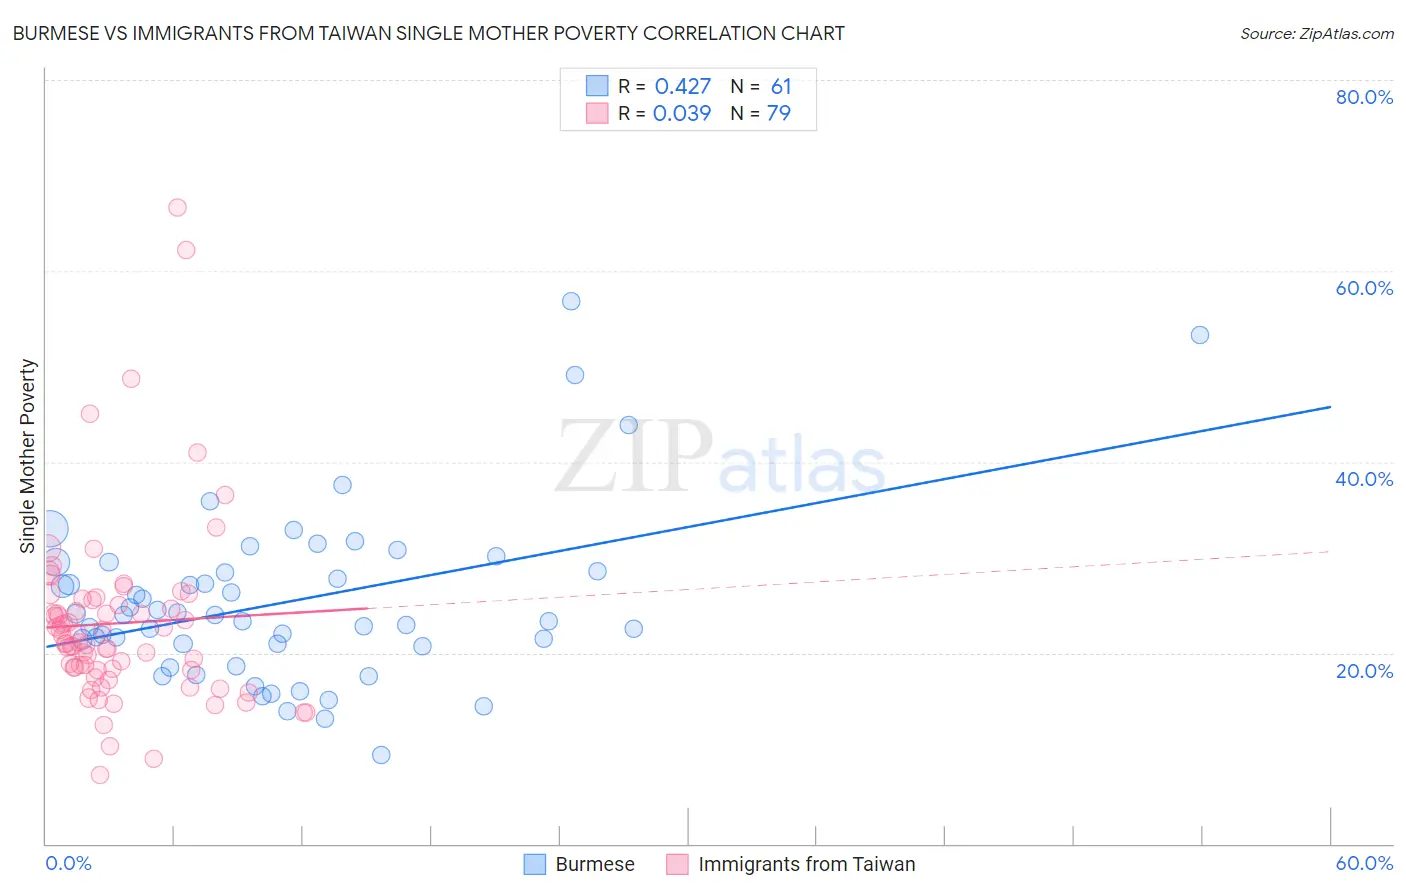
Burmese vs Immigrants from Taiwan Single Mother Poverty Correlation Chart
The statistical analysis conducted on geographies consisting of 450,482,396 people shows a moderate positive correlation between the proportion of Burmese and poverty level among single mothers in the United States with a correlation coefficient (R) of 0.427 and weighted average of 26.2%. Similarly, the statistical analysis conducted on geographies consisting of 291,292,084 people shows no correlation between the proportion of Immigrants from Taiwan and poverty level among single mothers in the United States with a correlation coefficient (R) of 0.039 and weighted average of 23.9%, a difference of 10.0%.
Single Mother Poverty Correlation Summary
| Measurement | Burmese | Immigrants from Taiwan |
| Minimum | 9.3% | 7.2% |
| Maximum | 56.9% | 66.7% |
| Range | 47.5% | 59.4% |
| Mean | 25.3% | 23.1% |
| Median | 23.9% | 21.1% |
| Interquartile 25% (IQ1) | 20.8% | 18.2% |
| Interquartile 75% (IQ3) | 29.0% | 25.5% |
| Interquartile Range (IQR) | 8.3% | 7.3% |
| Standard Deviation (Sample) | 9.0% | 9.7% |
| Standard Deviation (Population) | 9.0% | 9.6% |
Demographics Similar to Burmese and Immigrants from Taiwan by Single Mother Poverty
In terms of single mother poverty, the demographic groups most similar to Burmese are Immigrants from Korea (26.2%, a difference of 0.17%), Immigrants from Bolivia (26.2%, a difference of 0.35%), Immigrants from China (26.1%, a difference of 0.54%), Immigrants from Eastern Asia (26.1%, a difference of 0.66%), and Immigrants from Pakistan (26.0%, a difference of 0.81%). Similarly, the demographic groups most similar to Immigrants from Taiwan are Filipino (24.3%, a difference of 1.9%), Immigrants from Hong Kong (24.4%, a difference of 2.1%), Thai (24.5%, a difference of 2.7%), Chinese (24.6%, a difference of 3.2%), and Immigrants from Iran (25.1%, a difference of 5.2%).
| Demographics | Rating | Rank | Single Mother Poverty |
| Immigrants | Taiwan | 100.0 /100 | #3 | Exceptional 23.9% |
| Filipinos | 100.0 /100 | #4 | Exceptional 24.3% |
| Immigrants | Hong Kong | 100.0 /100 | #5 | Exceptional 24.4% |
| Thais | 100.0 /100 | #6 | Exceptional 24.5% |
| Chinese | 100.0 /100 | #7 | Exceptional 24.6% |
| Immigrants | Iran | 100.0 /100 | #8 | Exceptional 25.1% |
| Immigrants | Lithuania | 100.0 /100 | #9 | Exceptional 25.2% |
| Immigrants | South Central Asia | 100.0 /100 | #10 | Exceptional 25.3% |
| Iranians | 100.0 /100 | #11 | Exceptional 25.5% |
| Bhutanese | 100.0 /100 | #12 | Exceptional 25.6% |
| Indians (Asian) | 100.0 /100 | #13 | Exceptional 25.8% |
| Immigrants | Singapore | 100.0 /100 | #14 | Exceptional 25.8% |
| Immigrants | Ireland | 100.0 /100 | #15 | Exceptional 25.8% |
| Bolivians | 100.0 /100 | #16 | Exceptional 25.9% |
| Asians | 100.0 /100 | #17 | Exceptional 26.0% |
| Immigrants | Pakistan | 100.0 /100 | #18 | Exceptional 26.0% |
| Immigrants | Eastern Asia | 100.0 /100 | #19 | Exceptional 26.1% |
| Immigrants | China | 100.0 /100 | #20 | Exceptional 26.1% |
| Immigrants | Bolivia | 100.0 /100 | #21 | Exceptional 26.2% |
| Immigrants | Korea | 100.0 /100 | #22 | Exceptional 26.2% |
| Burmese | 100.0 /100 | #23 | Exceptional 26.2% |