Danish vs Immigrants from Taiwan Single Mother Poverty
COMPARE
Danish
Immigrants from Taiwan
Single Mother Poverty
Single Mother Poverty Comparison
Danes
Immigrants from Taiwan
28.5%
SINGLE MOTHER POVERTY
87.1/ 100
METRIC RATING
141st/ 347
METRIC RANK
23.9%
SINGLE MOTHER POVERTY
100.0/ 100
METRIC RATING
3rd/ 347
METRIC RANK
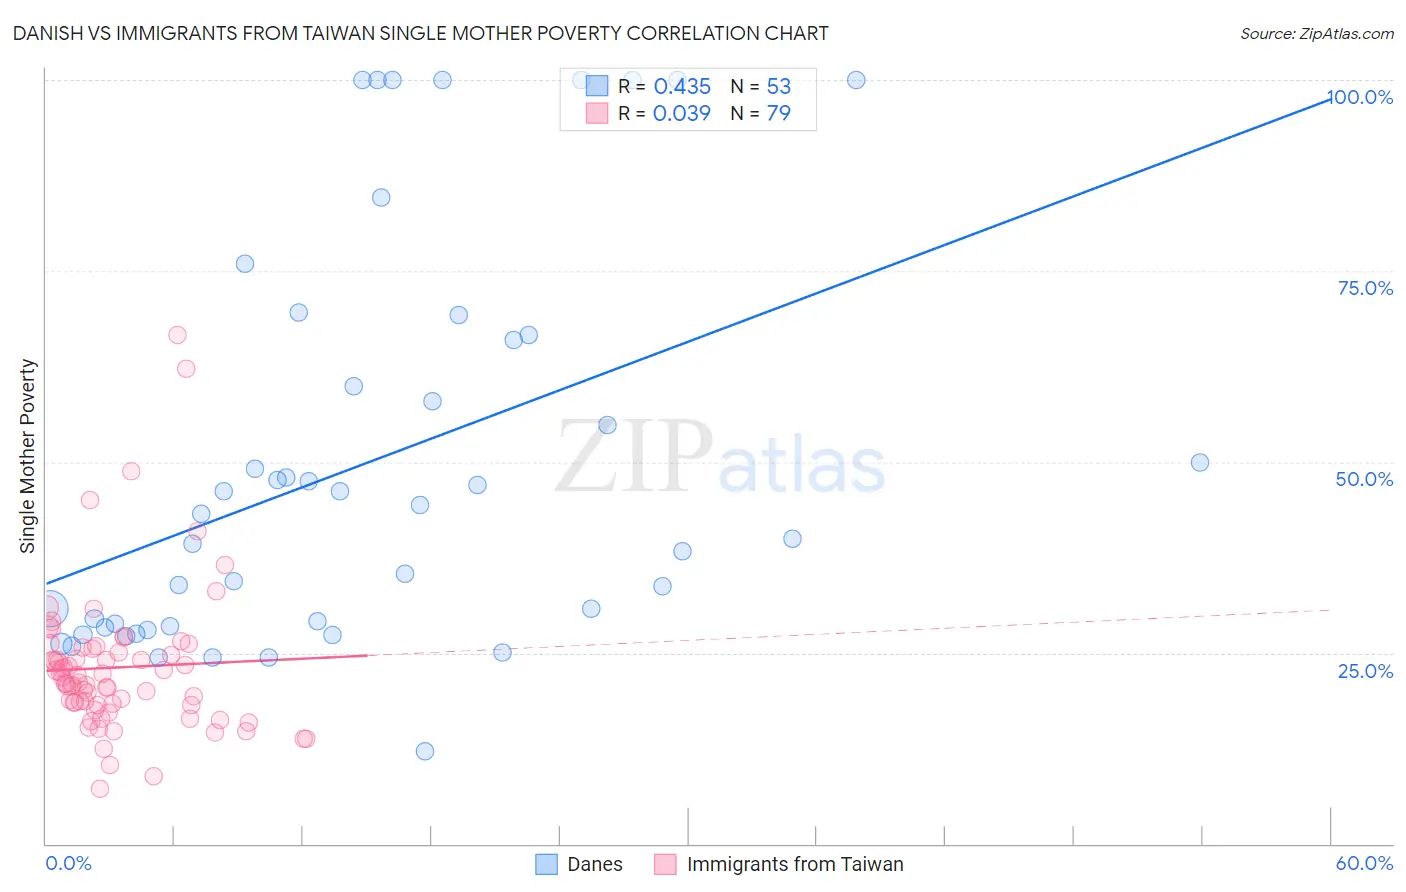
Danish vs Immigrants from Taiwan Single Mother Poverty Correlation Chart
The statistical analysis conducted on geographies consisting of 456,210,037 people shows a moderate positive correlation between the proportion of Danes and poverty level among single mothers in the United States with a correlation coefficient (R) of 0.435 and weighted average of 28.5%. Similarly, the statistical analysis conducted on geographies consisting of 291,292,084 people shows no correlation between the proportion of Immigrants from Taiwan and poverty level among single mothers in the United States with a correlation coefficient (R) of 0.039 and weighted average of 23.9%, a difference of 19.5%.
Single Mother Poverty Correlation Summary
| Measurement | Danish | Immigrants from Taiwan |
| Minimum | 12.1% | 7.2% |
| Maximum | 100.0% | 66.7% |
| Range | 87.9% | 59.4% |
| Mean | 49.7% | 23.1% |
| Median | 43.2% | 21.1% |
| Interquartile 25% (IQ1) | 28.4% | 18.2% |
| Interquartile 75% (IQ3) | 66.3% | 25.5% |
| Interquartile Range (IQR) | 37.9% | 7.3% |
| Standard Deviation (Sample) | 26.1% | 9.7% |
| Standard Deviation (Population) | 25.9% | 9.6% |
Similar Demographics by Single Mother Poverty
Demographics Similar to Danes by Single Mother Poverty
In terms of single mother poverty, the demographic groups most similar to Danes are South African (28.5%, a difference of 0.050%), Immigrants from North America (28.5%, a difference of 0.060%), Luxembourger (28.5%, a difference of 0.070%), Immigrants from Colombia (28.5%, a difference of 0.10%), and Samoan (28.5%, a difference of 0.11%).
| Demographics | Rating | Rank | Single Mother Poverty |
| Immigrants | Southern Europe | 89.2 /100 | #134 | Excellent 28.4% |
| Immigrants | Spain | 89.2 /100 | #135 | Excellent 28.4% |
| Native Hawaiians | 88.9 /100 | #136 | Excellent 28.4% |
| Immigrants | Canada | 88.9 /100 | #137 | Excellent 28.4% |
| Immigrants | Belgium | 88.5 /100 | #138 | Excellent 28.5% |
| Samoans | 88.1 /100 | #139 | Excellent 28.5% |
| Immigrants | Colombia | 88.0 /100 | #140 | Excellent 28.5% |
| Danes | 87.1 /100 | #141 | Excellent 28.5% |
| South Africans | 86.6 /100 | #142 | Excellent 28.5% |
| Immigrants | North America | 86.5 /100 | #143 | Excellent 28.5% |
| Luxembourgers | 86.4 /100 | #144 | Excellent 28.5% |
| Immigrants | South America | 86.1 /100 | #145 | Excellent 28.5% |
| Immigrants | Denmark | 86.1 /100 | #146 | Excellent 28.5% |
| Immigrants | Lebanon | 85.3 /100 | #147 | Excellent 28.6% |
| Syrians | 85.3 /100 | #148 | Excellent 28.6% |
Demographics Similar to Immigrants from Taiwan by Single Mother Poverty
In terms of single mother poverty, the demographic groups most similar to Immigrants from Taiwan are Immigrants from India (23.8%, a difference of 0.20%), Assyrian/Chaldean/Syriac (23.8%, a difference of 0.21%), Filipino (24.3%, a difference of 1.9%), Immigrants from Hong Kong (24.4%, a difference of 2.1%), and Thai (24.5%, a difference of 2.7%).
| Demographics | Rating | Rank | Single Mother Poverty |
| Assyrians/Chaldeans/Syriacs | 100.0 /100 | #1 | Exceptional 23.8% |
| Immigrants | India | 100.0 /100 | #2 | Exceptional 23.8% |
| Immigrants | Taiwan | 100.0 /100 | #3 | Exceptional 23.9% |
| Filipinos | 100.0 /100 | #4 | Exceptional 24.3% |
| Immigrants | Hong Kong | 100.0 /100 | #5 | Exceptional 24.4% |
| Thais | 100.0 /100 | #6 | Exceptional 24.5% |
| Chinese | 100.0 /100 | #7 | Exceptional 24.6% |
| Immigrants | Iran | 100.0 /100 | #8 | Exceptional 25.1% |
| Immigrants | Lithuania | 100.0 /100 | #9 | Exceptional 25.2% |
| Immigrants | South Central Asia | 100.0 /100 | #10 | Exceptional 25.3% |
| Iranians | 100.0 /100 | #11 | Exceptional 25.5% |
| Bhutanese | 100.0 /100 | #12 | Exceptional 25.6% |
| Indians (Asian) | 100.0 /100 | #13 | Exceptional 25.8% |
| Immigrants | Singapore | 100.0 /100 | #14 | Exceptional 25.8% |
| Immigrants | Ireland | 100.0 /100 | #15 | Exceptional 25.8% |