Navajo vs Yup'ik Single Mother Poverty
COMPARE
Navajo
Yup'ik
Single Mother Poverty
Single Mother Poverty Comparison
Navajo
Yup'ik
40.2%
SINGLE MOTHER POVERTY
0.0/ 100
METRIC RATING
342nd/ 347
METRIC RANK
32.5%
SINGLE MOTHER POVERTY
0.0/ 100
METRIC RATING
286th/ 347
METRIC RANK
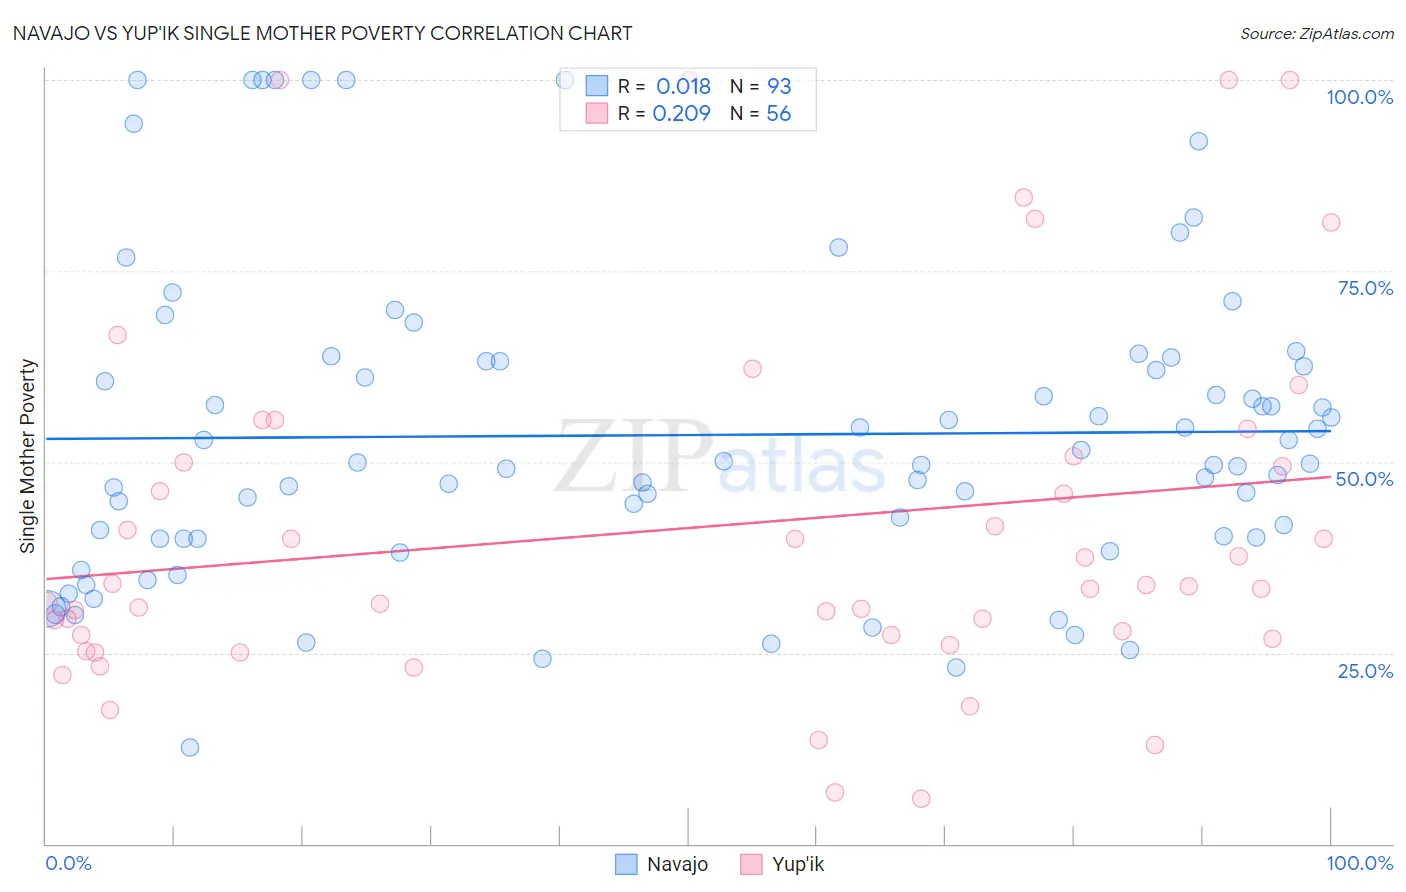
Navajo vs Yup'ik Single Mother Poverty Correlation Chart
The statistical analysis conducted on geographies consisting of 222,508,817 people shows no correlation between the proportion of Navajo and poverty level among single mothers in the United States with a correlation coefficient (R) of 0.018 and weighted average of 40.2%. Similarly, the statistical analysis conducted on geographies consisting of 39,732,342 people shows a weak positive correlation between the proportion of Yup'ik and poverty level among single mothers in the United States with a correlation coefficient (R) of 0.209 and weighted average of 32.5%, a difference of 23.9%.
Single Mother Poverty Correlation Summary
| Measurement | Navajo | Yup'ik |
| Minimum | 12.6% | 5.9% |
| Maximum | 100.0% | 100.0% |
| Range | 87.4% | 94.1% |
| Mean | 53.5% | 41.4% |
| Median | 49.8% | 33.5% |
| Interquartile 25% (IQ1) | 40.0% | 27.1% |
| Interquartile 75% (IQ3) | 63.1% | 50.3% |
| Interquartile Range (IQR) | 23.1% | 23.3% |
| Standard Deviation (Sample) | 20.3% | 23.6% |
| Standard Deviation (Population) | 20.2% | 23.4% |
Similar Demographics by Single Mother Poverty
Demographics Similar to Navajo by Single Mother Poverty
In terms of single mother poverty, the demographic groups most similar to Navajo are Cajun (40.3%, a difference of 0.33%), Colville (39.3%, a difference of 2.4%), Sioux (38.8%, a difference of 3.7%), Crow (38.6%, a difference of 4.1%), and Pima (38.6%, a difference of 4.2%).
| Demographics | Rating | Rank | Single Mother Poverty |
| Menominee | 0.0 /100 | #333 | Tragic 37.1% |
| Pueblo | 0.0 /100 | #334 | Tragic 37.2% |
| Yuman | 0.0 /100 | #335 | Tragic 37.8% |
| Cheyenne | 0.0 /100 | #336 | Tragic 38.5% |
| Immigrants | Yemen | 0.0 /100 | #337 | Tragic 38.5% |
| Pima | 0.0 /100 | #338 | Tragic 38.6% |
| Crow | 0.0 /100 | #339 | Tragic 38.6% |
| Sioux | 0.0 /100 | #340 | Tragic 38.8% |
| Colville | 0.0 /100 | #341 | Tragic 39.3% |
| Navajo | 0.0 /100 | #342 | Tragic 40.2% |
| Cajuns | 0.0 /100 | #343 | Tragic 40.3% |
| Tohono O'odham | 0.0 /100 | #344 | Tragic 43.0% |
| Lumbee | 0.0 /100 | #345 | Tragic 43.2% |
| Houma | 0.0 /100 | #346 | Tragic 43.5% |
| Puerto Ricans | 0.0 /100 | #347 | Tragic 44.5% |
Demographics Similar to Yup'ik by Single Mother Poverty
In terms of single mother poverty, the demographic groups most similar to Yup'ik are Immigrants from Latin America (32.4%, a difference of 0.070%), Immigrants from Dominica (32.5%, a difference of 0.13%), Indonesian (32.4%, a difference of 0.19%), Somali (32.6%, a difference of 0.35%), and U.S. Virgin Islander (32.6%, a difference of 0.38%).
| Demographics | Rating | Rank | Single Mother Poverty |
| Marshallese | 0.0 /100 | #279 | Tragic 32.1% |
| Immigrants | Nonimmigrants | 0.0 /100 | #280 | Tragic 32.2% |
| Cree | 0.0 /100 | #281 | Tragic 32.2% |
| Immigrants | Azores | 0.0 /100 | #282 | Tragic 32.2% |
| Spanish Americans | 0.0 /100 | #283 | Tragic 32.3% |
| Indonesians | 0.0 /100 | #284 | Tragic 32.4% |
| Immigrants | Latin America | 0.0 /100 | #285 | Tragic 32.4% |
| Yup'ik | 0.0 /100 | #286 | Tragic 32.5% |
| Immigrants | Dominica | 0.0 /100 | #287 | Tragic 32.5% |
| Somalis | 0.0 /100 | #288 | Tragic 32.6% |
| U.S. Virgin Islanders | 0.0 /100 | #289 | Tragic 32.6% |
| Osage | 0.0 /100 | #290 | Tragic 32.6% |
| Guatemalans | 0.0 /100 | #291 | Tragic 32.9% |
| Shoshone | 0.0 /100 | #292 | Tragic 32.9% |
| Aleuts | 0.0 /100 | #293 | Tragic 32.9% |