Navajo vs Kiowa Single Mother Poverty
COMPARE
Navajo
Kiowa
Single Mother Poverty
Single Mother Poverty Comparison
Navajo
Kiowa
40.2%
SINGLE MOTHER POVERTY
0.0/ 100
METRIC RATING
342nd/ 347
METRIC RANK
35.5%
SINGLE MOTHER POVERTY
0.0/ 100
METRIC RATING
323rd/ 347
METRIC RANK
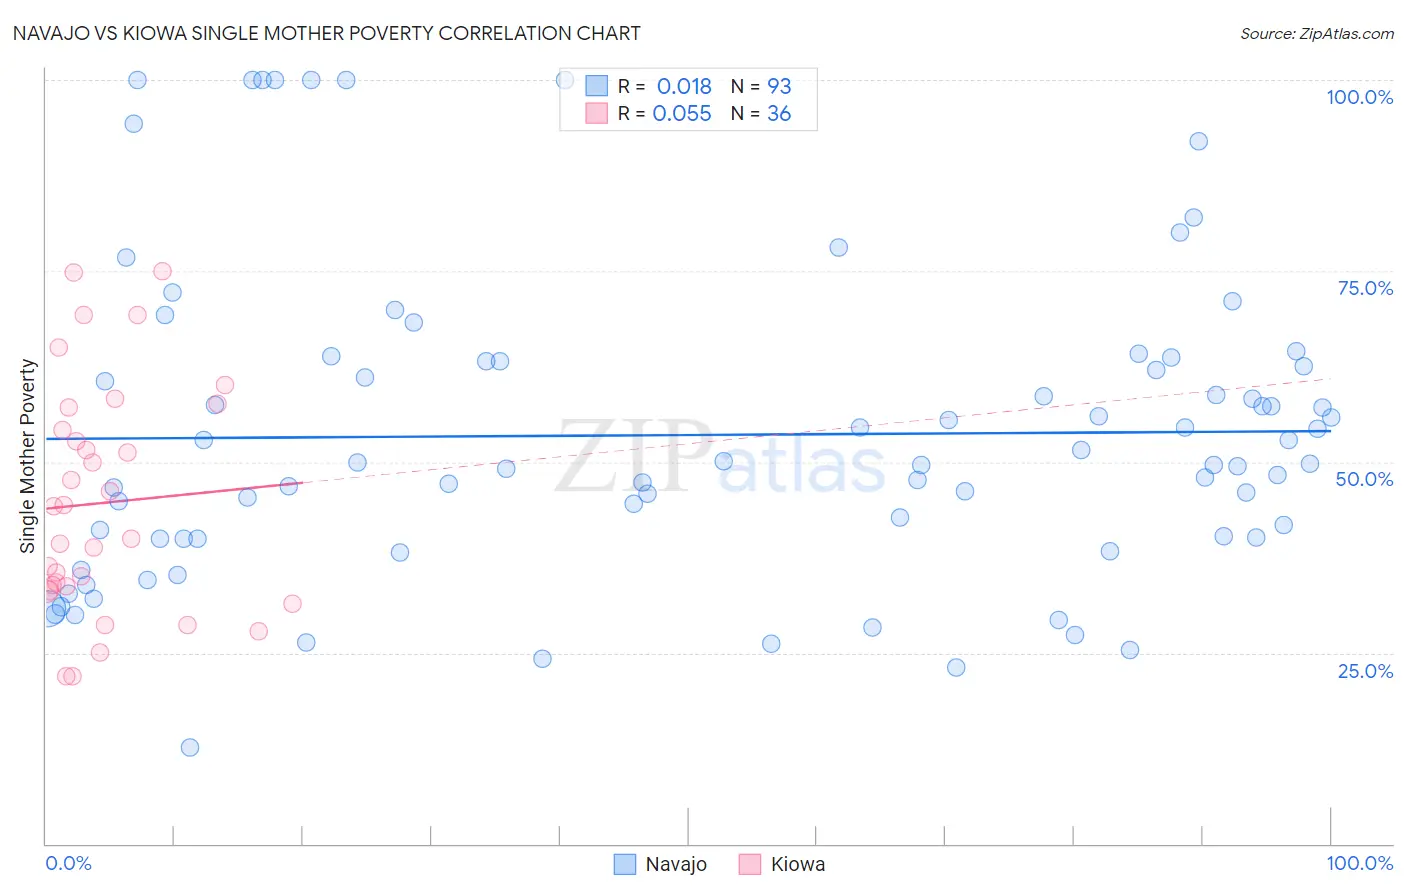
Navajo vs Kiowa Single Mother Poverty Correlation Chart
The statistical analysis conducted on geographies consisting of 222,508,817 people shows no correlation between the proportion of Navajo and poverty level among single mothers in the United States with a correlation coefficient (R) of 0.018 and weighted average of 40.2%. Similarly, the statistical analysis conducted on geographies consisting of 55,943,976 people shows a slight positive correlation between the proportion of Kiowa and poverty level among single mothers in the United States with a correlation coefficient (R) of 0.055 and weighted average of 35.5%, a difference of 13.4%.
Single Mother Poverty Correlation Summary
| Measurement | Navajo | Kiowa |
| Minimum | 12.6% | 21.9% |
| Maximum | 100.0% | 75.0% |
| Range | 87.4% | 53.1% |
| Mean | 53.5% | 44.6% |
| Median | 49.8% | 42.1% |
| Interquartile 25% (IQ1) | 40.0% | 33.5% |
| Interquartile 75% (IQ3) | 63.1% | 55.7% |
| Interquartile Range (IQR) | 23.1% | 22.2% |
| Standard Deviation (Sample) | 20.3% | 15.0% |
| Standard Deviation (Population) | 20.2% | 14.7% |
Demographics Similar to Navajo and Kiowa by Single Mother Poverty
In terms of single mother poverty, the demographic groups most similar to Navajo are Colville (39.3%, a difference of 2.4%), Sioux (38.8%, a difference of 3.7%), Crow (38.6%, a difference of 4.1%), Pima (38.6%, a difference of 4.2%), and Immigrants from Yemen (38.5%, a difference of 4.4%). Similarly, the demographic groups most similar to Kiowa are Ottawa (35.5%, a difference of 0.21%), Ute (35.7%, a difference of 0.69%), Black/African American (35.2%, a difference of 0.71%), Seminole (35.8%, a difference of 0.99%), and Yakama (36.4%, a difference of 2.6%).
| Demographics | Rating | Rank | Single Mother Poverty |
| Blacks/African Americans | 0.0 /100 | #322 | Tragic 35.2% |
| Kiowa | 0.0 /100 | #323 | Tragic 35.5% |
| Ottawa | 0.0 /100 | #324 | Tragic 35.5% |
| Ute | 0.0 /100 | #325 | Tragic 35.7% |
| Seminole | 0.0 /100 | #326 | Tragic 35.8% |
| Yakama | 0.0 /100 | #327 | Tragic 36.4% |
| Choctaw | 0.0 /100 | #328 | Tragic 36.4% |
| Apache | 0.0 /100 | #329 | Tragic 36.6% |
| Natives/Alaskans | 0.0 /100 | #330 | Tragic 36.6% |
| Creek | 0.0 /100 | #331 | Tragic 36.7% |
| Dutch West Indians | 0.0 /100 | #332 | Tragic 36.8% |
| Menominee | 0.0 /100 | #333 | Tragic 37.1% |
| Pueblo | 0.0 /100 | #334 | Tragic 37.2% |
| Yuman | 0.0 /100 | #335 | Tragic 37.8% |
| Cheyenne | 0.0 /100 | #336 | Tragic 38.5% |
| Immigrants | Yemen | 0.0 /100 | #337 | Tragic 38.5% |
| Pima | 0.0 /100 | #338 | Tragic 38.6% |
| Crow | 0.0 /100 | #339 | Tragic 38.6% |
| Sioux | 0.0 /100 | #340 | Tragic 38.8% |
| Colville | 0.0 /100 | #341 | Tragic 39.3% |
| Navajo | 0.0 /100 | #342 | Tragic 40.2% |