Navajo vs British Single Mother Poverty
COMPARE
Navajo
British
Single Mother Poverty
Single Mother Poverty Comparison
Navajo
British
40.2%
SINGLE MOTHER POVERTY
0.0/ 100
METRIC RATING
342nd/ 347
METRIC RANK
29.2%
SINGLE MOTHER POVERTY
50.6/ 100
METRIC RATING
173rd/ 347
METRIC RANK
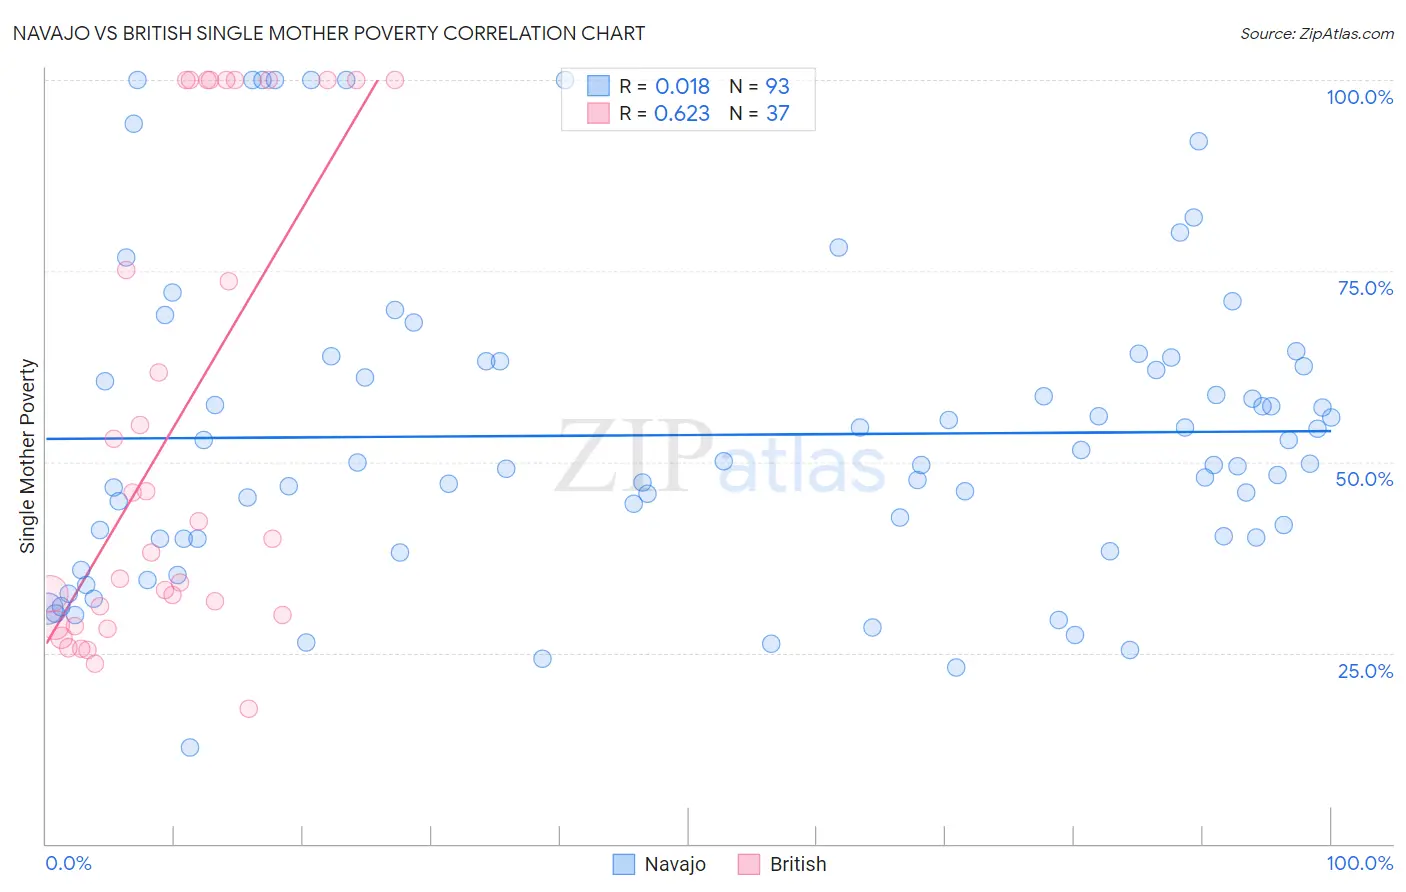
Navajo vs British Single Mother Poverty Correlation Chart
The statistical analysis conducted on geographies consisting of 222,508,817 people shows no correlation between the proportion of Navajo and poverty level among single mothers in the United States with a correlation coefficient (R) of 0.018 and weighted average of 40.2%. Similarly, the statistical analysis conducted on geographies consisting of 510,068,418 people shows a significant positive correlation between the proportion of British and poverty level among single mothers in the United States with a correlation coefficient (R) of 0.623 and weighted average of 29.2%, a difference of 37.9%.
Single Mother Poverty Correlation Summary
| Measurement | Navajo | British |
| Minimum | 12.6% | 17.7% |
| Maximum | 100.0% | 100.0% |
| Range | 87.4% | 82.3% |
| Mean | 53.5% | 54.6% |
| Median | 49.8% | 40.0% |
| Interquartile 25% (IQ1) | 40.0% | 29.4% |
| Interquartile 75% (IQ3) | 63.1% | 100.0% |
| Interquartile Range (IQR) | 23.1% | 70.6% |
| Standard Deviation (Sample) | 20.3% | 30.6% |
| Standard Deviation (Population) | 20.2% | 30.2% |
Similar Demographics by Single Mother Poverty
Demographics Similar to Navajo by Single Mother Poverty
In terms of single mother poverty, the demographic groups most similar to Navajo are Cajun (40.3%, a difference of 0.33%), Colville (39.3%, a difference of 2.4%), Sioux (38.8%, a difference of 3.7%), Crow (38.6%, a difference of 4.1%), and Pima (38.6%, a difference of 4.2%).
| Demographics | Rating | Rank | Single Mother Poverty |
| Menominee | 0.0 /100 | #333 | Tragic 37.1% |
| Pueblo | 0.0 /100 | #334 | Tragic 37.2% |
| Yuman | 0.0 /100 | #335 | Tragic 37.8% |
| Cheyenne | 0.0 /100 | #336 | Tragic 38.5% |
| Immigrants | Yemen | 0.0 /100 | #337 | Tragic 38.5% |
| Pima | 0.0 /100 | #338 | Tragic 38.6% |
| Crow | 0.0 /100 | #339 | Tragic 38.6% |
| Sioux | 0.0 /100 | #340 | Tragic 38.8% |
| Colville | 0.0 /100 | #341 | Tragic 39.3% |
| Navajo | 0.0 /100 | #342 | Tragic 40.2% |
| Cajuns | 0.0 /100 | #343 | Tragic 40.3% |
| Tohono O'odham | 0.0 /100 | #344 | Tragic 43.0% |
| Lumbee | 0.0 /100 | #345 | Tragic 43.2% |
| Houma | 0.0 /100 | #346 | Tragic 43.5% |
| Puerto Ricans | 0.0 /100 | #347 | Tragic 44.5% |
Demographics Similar to British by Single Mother Poverty
In terms of single mother poverty, the demographic groups most similar to British are Immigrants from Saudi Arabia (29.2%, a difference of 0.030%), Immigrants from Costa Rica (29.2%, a difference of 0.090%), Hawaiian (29.2%, a difference of 0.13%), Carpatho Rusyn (29.1%, a difference of 0.16%), and New Zealander (29.1%, a difference of 0.22%).
| Demographics | Rating | Rank | Single Mother Poverty |
| Inupiat | 60.4 /100 | #166 | Good 29.0% |
| Costa Ricans | 58.4 /100 | #167 | Average 29.0% |
| Europeans | 57.6 /100 | #168 | Average 29.1% |
| Immigrants | Uruguay | 57.2 /100 | #169 | Average 29.1% |
| New Zealanders | 55.1 /100 | #170 | Average 29.1% |
| Puget Sound Salish | 55.1 /100 | #171 | Average 29.1% |
| Carpatho Rusyns | 53.8 /100 | #172 | Average 29.1% |
| British | 50.6 /100 | #173 | Average 29.2% |
| Immigrants | Saudi Arabia | 50.0 /100 | #174 | Average 29.2% |
| Immigrants | Costa Rica | 48.8 /100 | #175 | Average 29.2% |
| Hawaiians | 47.8 /100 | #176 | Average 29.2% |
| Immigrants | Bosnia and Herzegovina | 45.1 /100 | #177 | Average 29.2% |
| South American Indians | 43.2 /100 | #178 | Average 29.3% |
| Immigrants | Uzbekistan | 42.6 /100 | #179 | Average 29.3% |
| Immigrants | Norway | 41.5 /100 | #180 | Average 29.3% |