Navajo vs Immigrants from Ireland Single Mother Poverty
COMPARE
Navajo
Immigrants from Ireland
Single Mother Poverty
Single Mother Poverty Comparison
Navajo
Immigrants from Ireland
40.2%
SINGLE MOTHER POVERTY
0.0/ 100
METRIC RATING
342nd/ 347
METRIC RANK
25.8%
SINGLE MOTHER POVERTY
100.0/ 100
METRIC RATING
15th/ 347
METRIC RANK
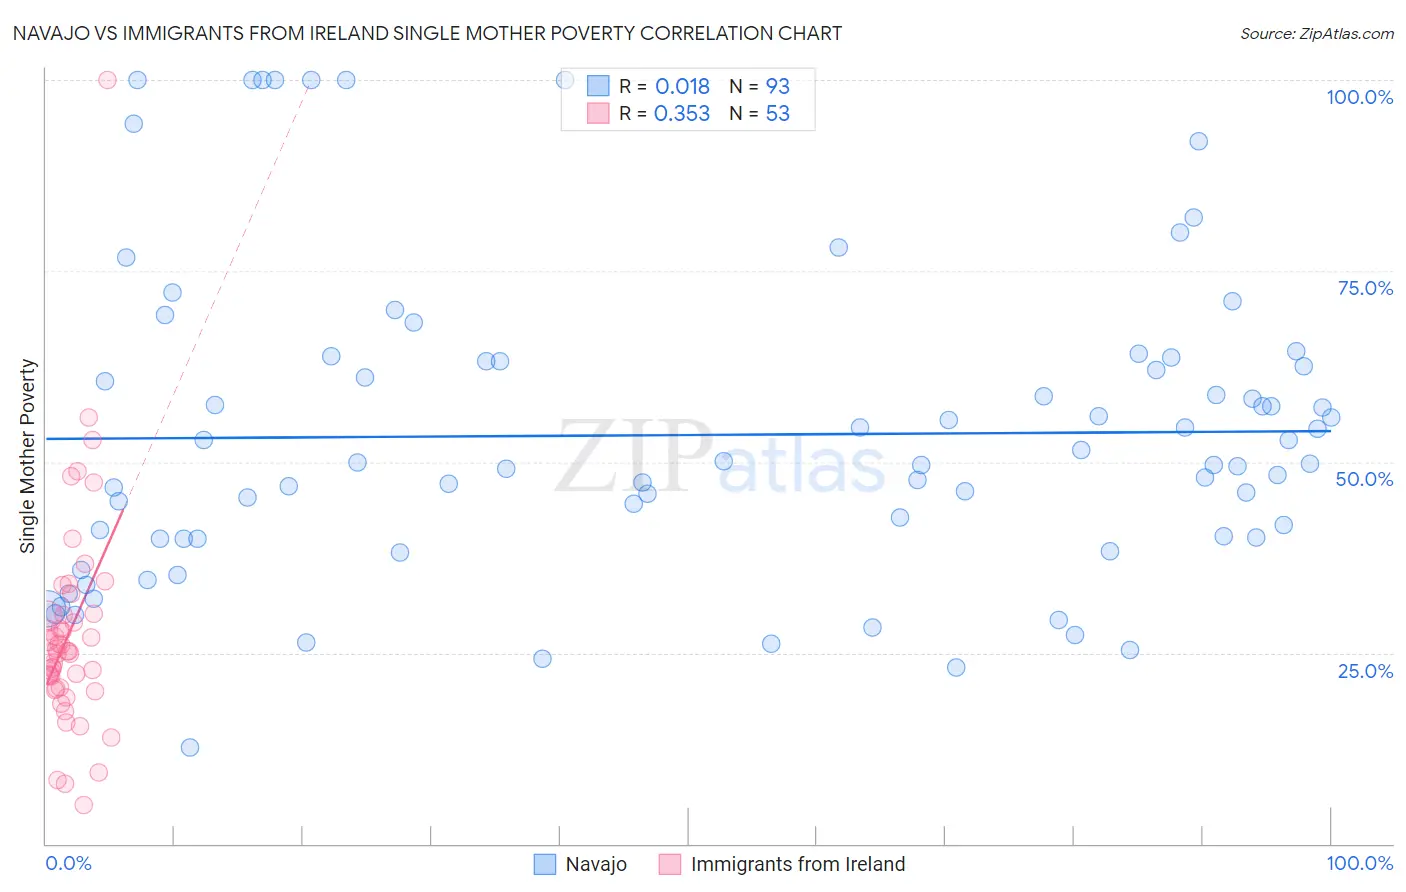
Navajo vs Immigrants from Ireland Single Mother Poverty Correlation Chart
The statistical analysis conducted on geographies consisting of 222,508,817 people shows no correlation between the proportion of Navajo and poverty level among single mothers in the United States with a correlation coefficient (R) of 0.018 and weighted average of 40.2%. Similarly, the statistical analysis conducted on geographies consisting of 234,765,496 people shows a mild positive correlation between the proportion of Immigrants from Ireland and poverty level among single mothers in the United States with a correlation coefficient (R) of 0.353 and weighted average of 25.8%, a difference of 55.6%.
Single Mother Poverty Correlation Summary
| Measurement | Navajo | Immigrants from Ireland |
| Minimum | 12.6% | 5.0% |
| Maximum | 100.0% | 100.0% |
| Range | 87.4% | 95.0% |
| Mean | 53.5% | 27.7% |
| Median | 49.8% | 25.2% |
| Interquartile 25% (IQ1) | 40.0% | 20.3% |
| Interquartile 75% (IQ3) | 63.1% | 30.0% |
| Interquartile Range (IQR) | 23.1% | 9.7% |
| Standard Deviation (Sample) | 20.3% | 14.7% |
| Standard Deviation (Population) | 20.2% | 14.5% |
Similar Demographics by Single Mother Poverty
Demographics Similar to Navajo by Single Mother Poverty
In terms of single mother poverty, the demographic groups most similar to Navajo are Cajun (40.3%, a difference of 0.33%), Colville (39.3%, a difference of 2.4%), Sioux (38.8%, a difference of 3.7%), Crow (38.6%, a difference of 4.1%), and Pima (38.6%, a difference of 4.2%).
| Demographics | Rating | Rank | Single Mother Poverty |
| Menominee | 0.0 /100 | #333 | Tragic 37.1% |
| Pueblo | 0.0 /100 | #334 | Tragic 37.2% |
| Yuman | 0.0 /100 | #335 | Tragic 37.8% |
| Cheyenne | 0.0 /100 | #336 | Tragic 38.5% |
| Immigrants | Yemen | 0.0 /100 | #337 | Tragic 38.5% |
| Pima | 0.0 /100 | #338 | Tragic 38.6% |
| Crow | 0.0 /100 | #339 | Tragic 38.6% |
| Sioux | 0.0 /100 | #340 | Tragic 38.8% |
| Colville | 0.0 /100 | #341 | Tragic 39.3% |
| Navajo | 0.0 /100 | #342 | Tragic 40.2% |
| Cajuns | 0.0 /100 | #343 | Tragic 40.3% |
| Tohono O'odham | 0.0 /100 | #344 | Tragic 43.0% |
| Lumbee | 0.0 /100 | #345 | Tragic 43.2% |
| Houma | 0.0 /100 | #346 | Tragic 43.5% |
| Puerto Ricans | 0.0 /100 | #347 | Tragic 44.5% |
Demographics Similar to Immigrants from Ireland by Single Mother Poverty
In terms of single mother poverty, the demographic groups most similar to Immigrants from Ireland are Immigrants from Singapore (25.8%, a difference of 0.18%), Bolivian (25.9%, a difference of 0.29%), Indian (Asian) (25.8%, a difference of 0.34%), Asian (26.0%, a difference of 0.47%), and Immigrants from Pakistan (26.0%, a difference of 0.75%).
| Demographics | Rating | Rank | Single Mother Poverty |
| Immigrants | Iran | 100.0 /100 | #8 | Exceptional 25.1% |
| Immigrants | Lithuania | 100.0 /100 | #9 | Exceptional 25.2% |
| Immigrants | South Central Asia | 100.0 /100 | #10 | Exceptional 25.3% |
| Iranians | 100.0 /100 | #11 | Exceptional 25.5% |
| Bhutanese | 100.0 /100 | #12 | Exceptional 25.6% |
| Indians (Asian) | 100.0 /100 | #13 | Exceptional 25.8% |
| Immigrants | Singapore | 100.0 /100 | #14 | Exceptional 25.8% |
| Immigrants | Ireland | 100.0 /100 | #15 | Exceptional 25.8% |
| Bolivians | 100.0 /100 | #16 | Exceptional 25.9% |
| Asians | 100.0 /100 | #17 | Exceptional 26.0% |
| Immigrants | Pakistan | 100.0 /100 | #18 | Exceptional 26.0% |
| Immigrants | Eastern Asia | 100.0 /100 | #19 | Exceptional 26.1% |
| Immigrants | China | 100.0 /100 | #20 | Exceptional 26.1% |
| Immigrants | Bolivia | 100.0 /100 | #21 | Exceptional 26.2% |
| Immigrants | Korea | 100.0 /100 | #22 | Exceptional 26.2% |