Navajo vs White/Caucasian Single Mother Poverty
COMPARE
Navajo
White/Caucasian
Single Mother Poverty
Single Mother Poverty Comparison
Navajo
Whites/Caucasians
40.2%
SINGLE MOTHER POVERTY
0.0/ 100
METRIC RATING
342nd/ 347
METRIC RANK
31.2%
SINGLE MOTHER POVERTY
0.3/ 100
METRIC RATING
260th/ 347
METRIC RANK
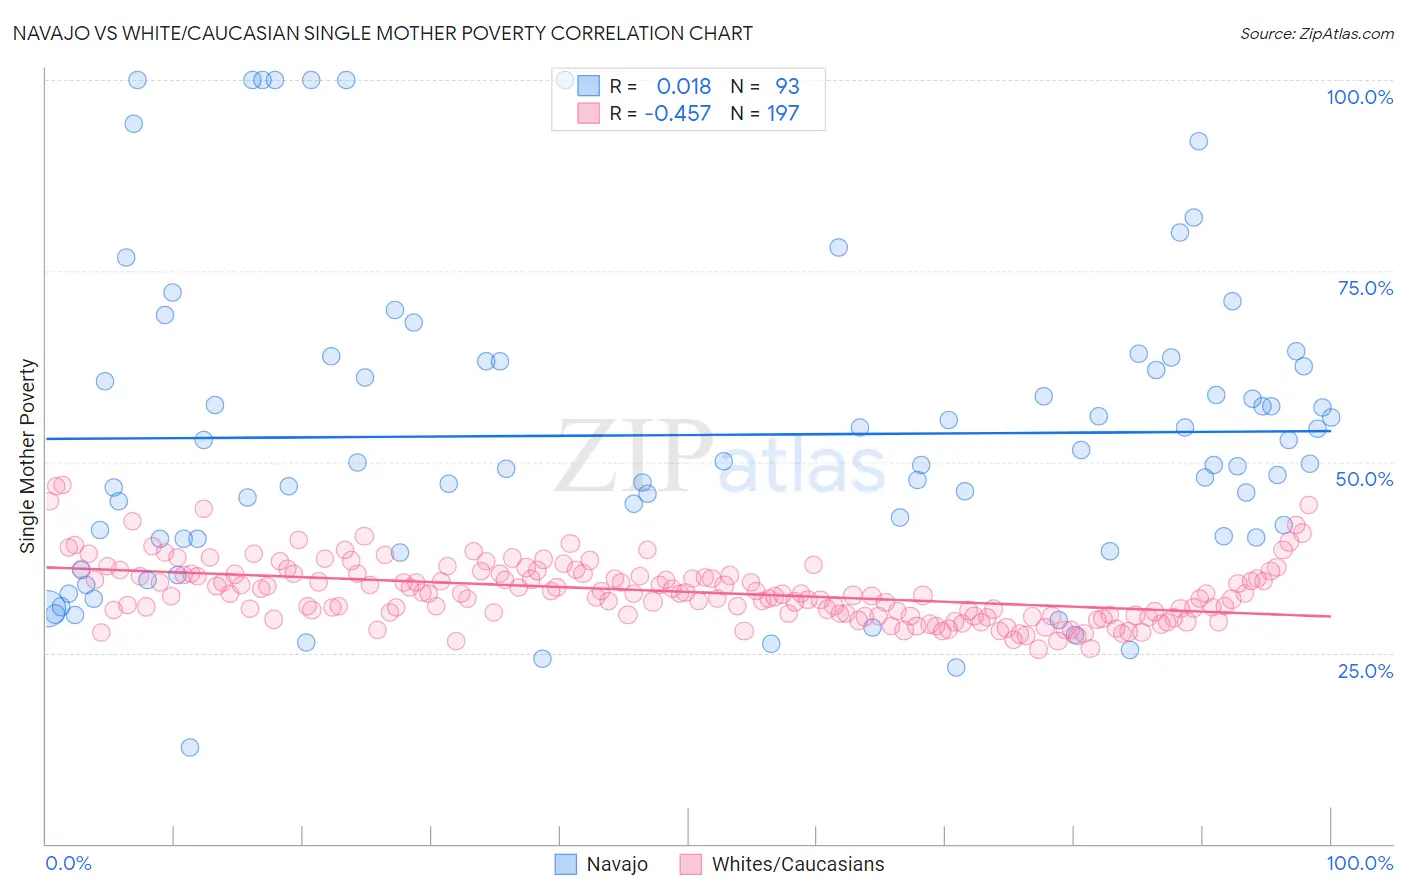
Navajo vs White/Caucasian Single Mother Poverty Correlation Chart
The statistical analysis conducted on geographies consisting of 222,508,817 people shows no correlation between the proportion of Navajo and poverty level among single mothers in the United States with a correlation coefficient (R) of 0.018 and weighted average of 40.2%. Similarly, the statistical analysis conducted on geographies consisting of 551,530,681 people shows a moderate negative correlation between the proportion of Whites/Caucasians and poverty level among single mothers in the United States with a correlation coefficient (R) of -0.457 and weighted average of 31.2%, a difference of 29.0%.
Single Mother Poverty Correlation Summary
| Measurement | Navajo | White/Caucasian |
| Minimum | 12.6% | 25.5% |
| Maximum | 100.0% | 47.0% |
| Range | 87.4% | 21.5% |
| Mean | 53.5% | 33.0% |
| Median | 49.8% | 32.7% |
| Interquartile 25% (IQ1) | 40.0% | 29.9% |
| Interquartile 75% (IQ3) | 63.1% | 35.3% |
| Interquartile Range (IQR) | 23.1% | 5.4% |
| Standard Deviation (Sample) | 20.3% | 4.0% |
| Standard Deviation (Population) | 20.2% | 4.0% |
Similar Demographics by Single Mother Poverty
Demographics Similar to Navajo by Single Mother Poverty
In terms of single mother poverty, the demographic groups most similar to Navajo are Cajun (40.3%, a difference of 0.33%), Colville (39.3%, a difference of 2.4%), Sioux (38.8%, a difference of 3.7%), Crow (38.6%, a difference of 4.1%), and Pima (38.6%, a difference of 4.2%).
| Demographics | Rating | Rank | Single Mother Poverty |
| Menominee | 0.0 /100 | #333 | Tragic 37.1% |
| Pueblo | 0.0 /100 | #334 | Tragic 37.2% |
| Yuman | 0.0 /100 | #335 | Tragic 37.8% |
| Cheyenne | 0.0 /100 | #336 | Tragic 38.5% |
| Immigrants | Yemen | 0.0 /100 | #337 | Tragic 38.5% |
| Pima | 0.0 /100 | #338 | Tragic 38.6% |
| Crow | 0.0 /100 | #339 | Tragic 38.6% |
| Sioux | 0.0 /100 | #340 | Tragic 38.8% |
| Colville | 0.0 /100 | #341 | Tragic 39.3% |
| Navajo | 0.0 /100 | #342 | Tragic 40.2% |
| Cajuns | 0.0 /100 | #343 | Tragic 40.3% |
| Tohono O'odham | 0.0 /100 | #344 | Tragic 43.0% |
| Lumbee | 0.0 /100 | #345 | Tragic 43.2% |
| Houma | 0.0 /100 | #346 | Tragic 43.5% |
| Puerto Ricans | 0.0 /100 | #347 | Tragic 44.5% |
Demographics Similar to Whites/Caucasians by Single Mother Poverty
In terms of single mother poverty, the demographic groups most similar to Whites/Caucasians are Immigrants from El Salvador (31.2%, a difference of 0.080%), Immigrants from Bangladesh (31.1%, a difference of 0.16%), Immigrants from Caribbean (31.1%, a difference of 0.19%), Hmong (31.2%, a difference of 0.21%), and Immigrants from Bahamas (31.1%, a difference of 0.28%).
| Demographics | Rating | Rank | Single Mother Poverty |
| Celtics | 0.6 /100 | #253 | Tragic 30.9% |
| Senegalese | 0.5 /100 | #254 | Tragic 31.0% |
| Belizeans | 0.5 /100 | #255 | Tragic 31.0% |
| Immigrants | West Indies | 0.4 /100 | #256 | Tragic 31.1% |
| Immigrants | Bahamas | 0.4 /100 | #257 | Tragic 31.1% |
| Immigrants | Caribbean | 0.4 /100 | #258 | Tragic 31.1% |
| Immigrants | Bangladesh | 0.4 /100 | #259 | Tragic 31.1% |
| Whites/Caucasians | 0.3 /100 | #260 | Tragic 31.2% |
| Immigrants | El Salvador | 0.3 /100 | #261 | Tragic 31.2% |
| Hmong | 0.3 /100 | #262 | Tragic 31.2% |
| Bahamians | 0.2 /100 | #263 | Tragic 31.3% |
| Immigrants | Ecuador | 0.2 /100 | #264 | Tragic 31.3% |
| German Russians | 0.2 /100 | #265 | Tragic 31.3% |
| Sub-Saharan Africans | 0.2 /100 | #266 | Tragic 31.4% |
| Immigrants | Belize | 0.2 /100 | #267 | Tragic 31.4% |