Native/Alaskan vs Puget Sound Salish Female Disability
COMPARE
Native/Alaskan
Puget Sound Salish
Female Disability
Female Disability Comparison
Natives/Alaskans
Puget Sound Salish
14.1%
FEMALE DISABILITY
0.0/ 100
METRIC RATING
324th/ 347
METRIC RANK
13.8%
FEMALE DISABILITY
0.0/ 100
METRIC RATING
314th/ 347
METRIC RANK
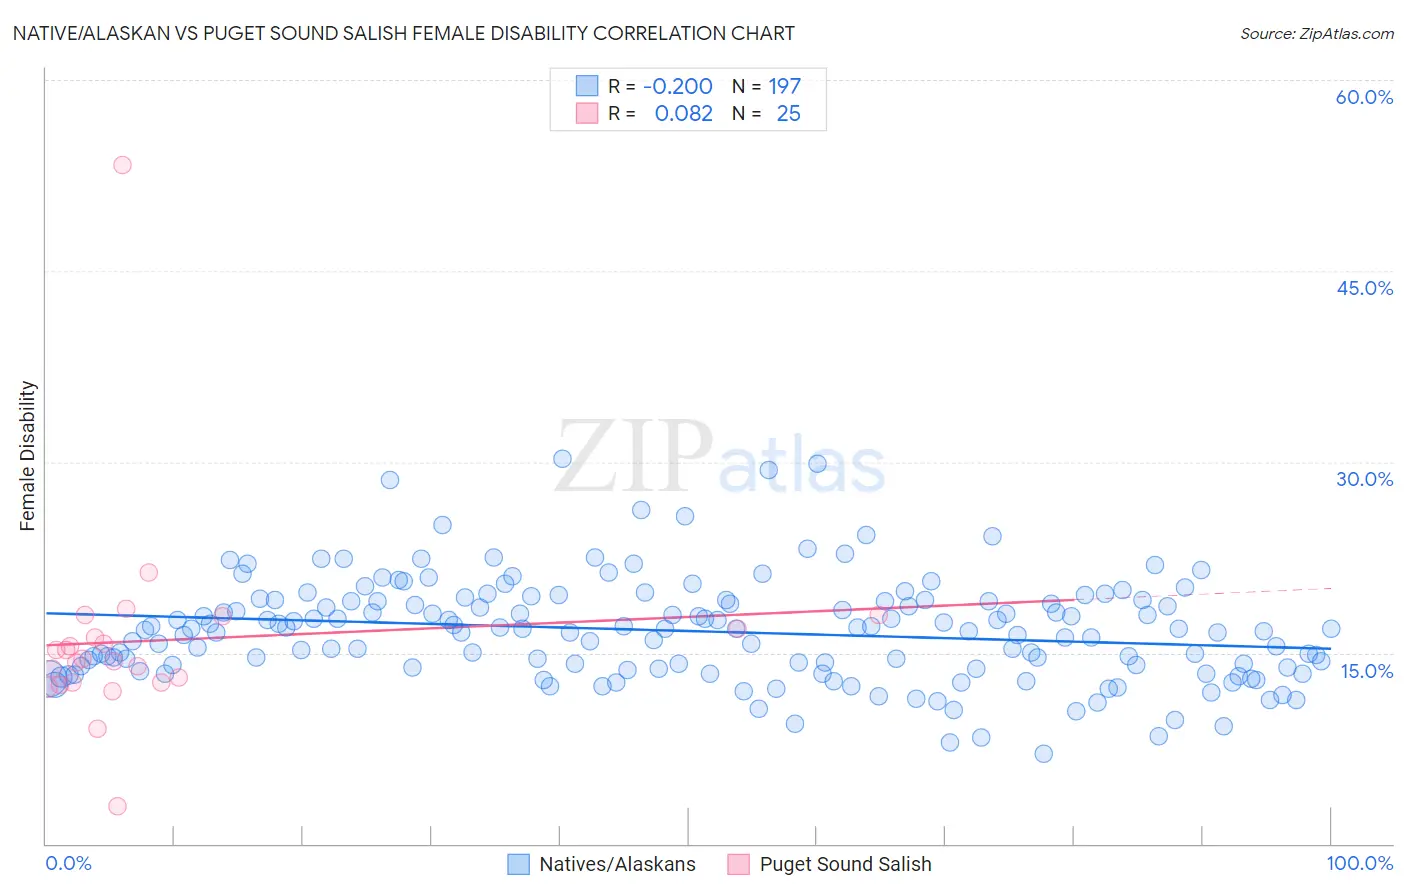
Native/Alaskan vs Puget Sound Salish Female Disability Correlation Chart
The statistical analysis conducted on geographies consisting of 512,836,768 people shows a weak negative correlation between the proportion of Natives/Alaskans and percentage of females with a disability in the United States with a correlation coefficient (R) of -0.200 and weighted average of 14.1%. Similarly, the statistical analysis conducted on geographies consisting of 46,152,398 people shows a slight positive correlation between the proportion of Puget Sound Salish and percentage of females with a disability in the United States with a correlation coefficient (R) of 0.082 and weighted average of 13.8%, a difference of 2.1%.
Female Disability Correlation Summary
| Measurement | Native/Alaskan | Puget Sound Salish |
| Minimum | 7.0% | 2.9% |
| Maximum | 30.2% | 53.3% |
| Range | 23.2% | 50.4% |
| Mean | 16.7% | 16.0% |
| Median | 16.8% | 14.5% |
| Interquartile 25% (IQ1) | 13.9% | 12.6% |
| Interquartile 75% (IQ3) | 19.1% | 17.4% |
| Interquartile Range (IQR) | 5.2% | 4.7% |
| Standard Deviation (Sample) | 4.0% | 8.5% |
| Standard Deviation (Population) | 4.0% | 8.4% |
Demographics Similar to Natives/Alaskans and Puget Sound Salish by Female Disability
In terms of female disability, the demographic groups most similar to Natives/Alaskans are Black/African American (14.1%, a difference of 0.020%), Navajo (14.2%, a difference of 0.14%), Pueblo (14.1%, a difference of 0.18%), Potawatomi (14.1%, a difference of 0.20%), and Comanche (14.2%, a difference of 0.25%). Similarly, the demographic groups most similar to Puget Sound Salish are Blackfeet (13.8%, a difference of 0.10%), Delaware (13.8%, a difference of 0.42%), Alaskan Athabascan (13.9%, a difference of 0.59%), Hopi (13.7%, a difference of 0.73%), and Spanish American (14.0%, a difference of 0.95%).
| Demographics | Rating | Rank | Female Disability |
| French American Indians | 0.0 /100 | #309 | Tragic 13.7% |
| Apache | 0.0 /100 | #310 | Tragic 13.7% |
| Hopi | 0.0 /100 | #311 | Tragic 13.7% |
| Delaware | 0.0 /100 | #312 | Tragic 13.8% |
| Blackfeet | 0.0 /100 | #313 | Tragic 13.8% |
| Puget Sound Salish | 0.0 /100 | #314 | Tragic 13.8% |
| Alaskan Athabascans | 0.0 /100 | #315 | Tragic 13.9% |
| Spanish Americans | 0.0 /100 | #316 | Tragic 14.0% |
| Chippewa | 0.0 /100 | #317 | Tragic 14.0% |
| Paiute | 0.0 /100 | #318 | Tragic 14.0% |
| Iroquois | 0.0 /100 | #319 | Tragic 14.0% |
| Americans | 0.0 /100 | #320 | Tragic 14.1% |
| Potawatomi | 0.0 /100 | #321 | Tragic 14.1% |
| Pueblo | 0.0 /100 | #322 | Tragic 14.1% |
| Blacks/African Americans | 0.0 /100 | #323 | Tragic 14.1% |
| Natives/Alaskans | 0.0 /100 | #324 | Tragic 14.1% |
| Navajo | 0.0 /100 | #325 | Tragic 14.2% |
| Comanche | 0.0 /100 | #326 | Tragic 14.2% |
| Ottawa | 0.0 /100 | #327 | Tragic 14.2% |
| Cape Verdeans | 0.0 /100 | #328 | Tragic 14.2% |
| Osage | 0.0 /100 | #329 | Tragic 14.3% |