Native/Alaskan vs Immigrants from Nicaragua Single Male Poverty
COMPARE
Native/Alaskan
Immigrants from Nicaragua
Single Male Poverty
Single Male Poverty Comparison
Natives/Alaskans
Immigrants from Nicaragua
19.6%
SINGLE MALE POVERTY
0.0/ 100
METRIC RATING
332nd/ 347
METRIC RANK
12.5%
SINGLE MALE POVERTY
84.8/ 100
METRIC RATING
130th/ 347
METRIC RANK
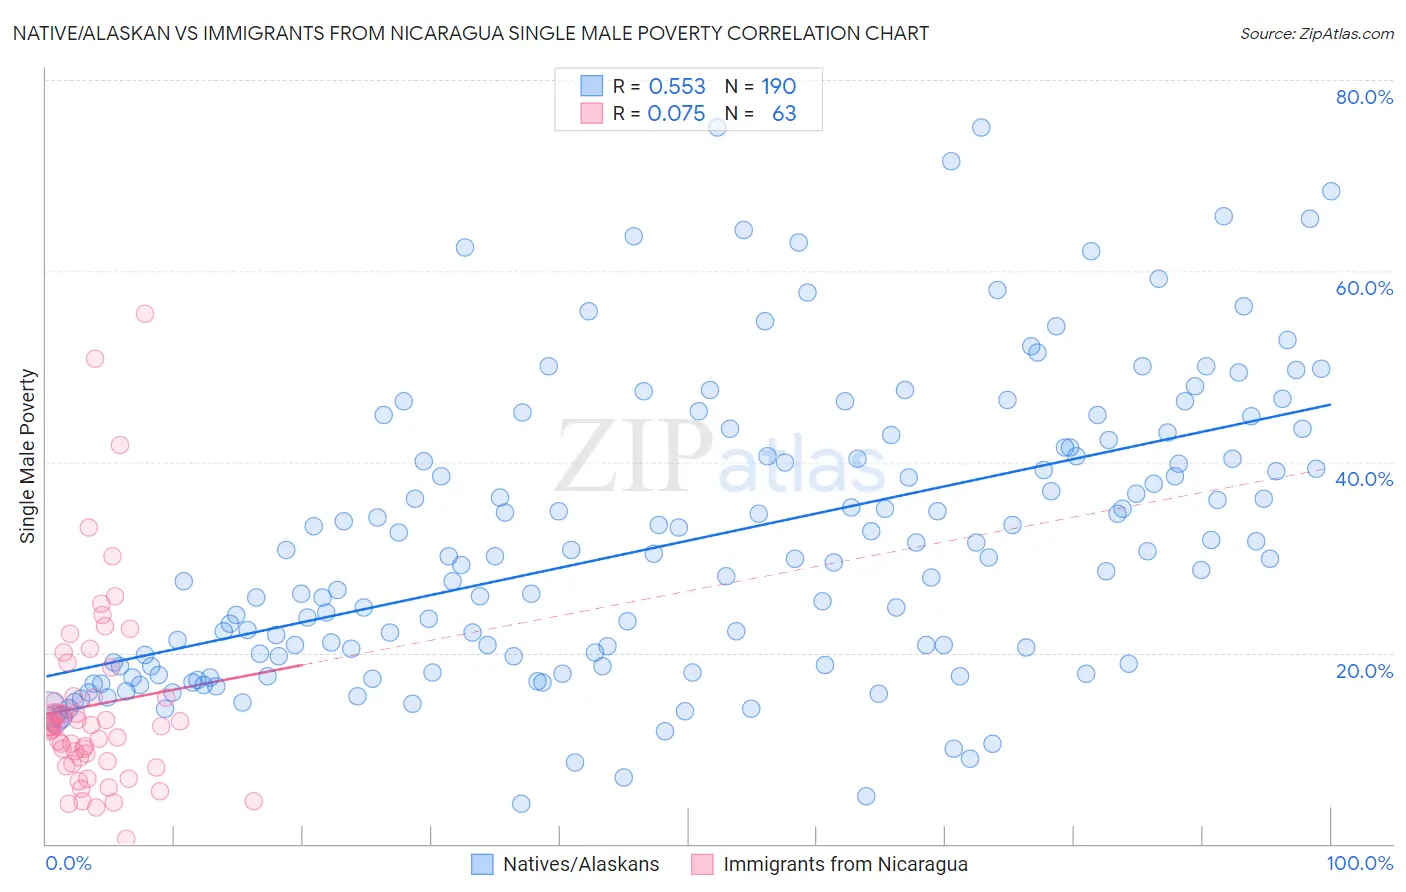
Native/Alaskan vs Immigrants from Nicaragua Single Male Poverty Correlation Chart
The statistical analysis conducted on geographies consisting of 444,255,067 people shows a substantial positive correlation between the proportion of Natives/Alaskans and poverty level among single males in the United States with a correlation coefficient (R) of 0.553 and weighted average of 19.6%. Similarly, the statistical analysis conducted on geographies consisting of 222,038,180 people shows a slight positive correlation between the proportion of Immigrants from Nicaragua and poverty level among single males in the United States with a correlation coefficient (R) of 0.075 and weighted average of 12.5%, a difference of 56.8%.
Single Male Poverty Correlation Summary
| Measurement | Native/Alaskan | Immigrants from Nicaragua |
| Minimum | 4.3% | 0.49% |
| Maximum | 75.0% | 55.6% |
| Range | 70.7% | 55.1% |
| Mean | 31.7% | 14.5% |
| Median | 29.9% | 12.3% |
| Interquartile 25% (IQ1) | 18.7% | 8.6% |
| Interquartile 75% (IQ3) | 41.5% | 15.4% |
| Interquartile Range (IQR) | 22.8% | 6.8% |
| Standard Deviation (Sample) | 15.2% | 10.3% |
| Standard Deviation (Population) | 15.2% | 10.2% |
Similar Demographics by Single Male Poverty
Demographics Similar to Natives/Alaskans by Single Male Poverty
In terms of single male poverty, the demographic groups most similar to Natives/Alaskans are Paiute (19.3%, a difference of 1.7%), Inupiat (20.0%, a difference of 1.9%), Pima (20.2%, a difference of 2.7%), Cajun (19.1%, a difference of 2.8%), and Colville (18.4%, a difference of 6.4%).
| Demographics | Rating | Rank | Single Male Poverty |
| Choctaw | 0.0 /100 | #325 | Tragic 17.0% |
| Central American Indians | 0.0 /100 | #326 | Tragic 17.2% |
| Menominee | 0.0 /100 | #327 | Tragic 17.7% |
| Kiowa | 0.0 /100 | #328 | Tragic 18.3% |
| Colville | 0.0 /100 | #329 | Tragic 18.4% |
| Cajuns | 0.0 /100 | #330 | Tragic 19.1% |
| Paiute | 0.0 /100 | #331 | Tragic 19.3% |
| Natives/Alaskans | 0.0 /100 | #332 | Tragic 19.6% |
| Inupiat | 0.0 /100 | #333 | Tragic 20.0% |
| Pima | 0.0 /100 | #334 | Tragic 20.2% |
| Yuman | 0.0 /100 | #335 | Tragic 21.3% |
| Tohono O'odham | 0.0 /100 | #336 | Tragic 21.6% |
| Apache | 0.0 /100 | #337 | Tragic 21.6% |
| Pueblo | 0.0 /100 | #338 | Tragic 21.6% |
| Arapaho | 0.0 /100 | #339 | Tragic 21.9% |
Demographics Similar to Immigrants from Nicaragua by Single Male Poverty
In terms of single male poverty, the demographic groups most similar to Immigrants from Nicaragua are Immigrants from Sierra Leone (12.5%, a difference of 0.080%), Ecuadorian (12.5%, a difference of 0.11%), Immigrants from Northern Europe (12.5%, a difference of 0.11%), Salvadoran (12.5%, a difference of 0.12%), and Immigrants from Western Asia (12.5%, a difference of 0.14%).
| Demographics | Rating | Rank | Single Male Poverty |
| Immigrants | Kenya | 87.6 /100 | #123 | Excellent 12.5% |
| Russians | 87.3 /100 | #124 | Excellent 12.5% |
| Immigrants | Jordan | 87.1 /100 | #125 | Excellent 12.5% |
| Romanians | 86.4 /100 | #126 | Excellent 12.5% |
| Immigrants | Netherlands | 86.2 /100 | #127 | Excellent 12.5% |
| Ecuadorians | 85.9 /100 | #128 | Excellent 12.5% |
| Immigrants | Sierra Leone | 85.5 /100 | #129 | Excellent 12.5% |
| Immigrants | Nicaragua | 84.8 /100 | #130 | Excellent 12.5% |
| Immigrants | Northern Europe | 83.7 /100 | #131 | Excellent 12.5% |
| Salvadorans | 83.7 /100 | #132 | Excellent 12.5% |
| Immigrants | Western Asia | 83.4 /100 | #133 | Excellent 12.5% |
| Immigrants | Ecuador | 82.1 /100 | #134 | Excellent 12.5% |
| Immigrants | Costa Rica | 81.9 /100 | #135 | Excellent 12.5% |
| Immigrants | Austria | 81.9 /100 | #136 | Excellent 12.5% |
| Ukrainians | 80.7 /100 | #137 | Excellent 12.6% |