Native/Alaskan vs Paraguayan Single Male Poverty
COMPARE
Native/Alaskan
Paraguayan
Single Male Poverty
Single Male Poverty Comparison
Natives/Alaskans
Paraguayans
19.6%
SINGLE MALE POVERTY
0.0/ 100
METRIC RATING
332nd/ 347
METRIC RANK
11.6%
SINGLE MALE POVERTY
99.9/ 100
METRIC RATING
51st/ 347
METRIC RANK
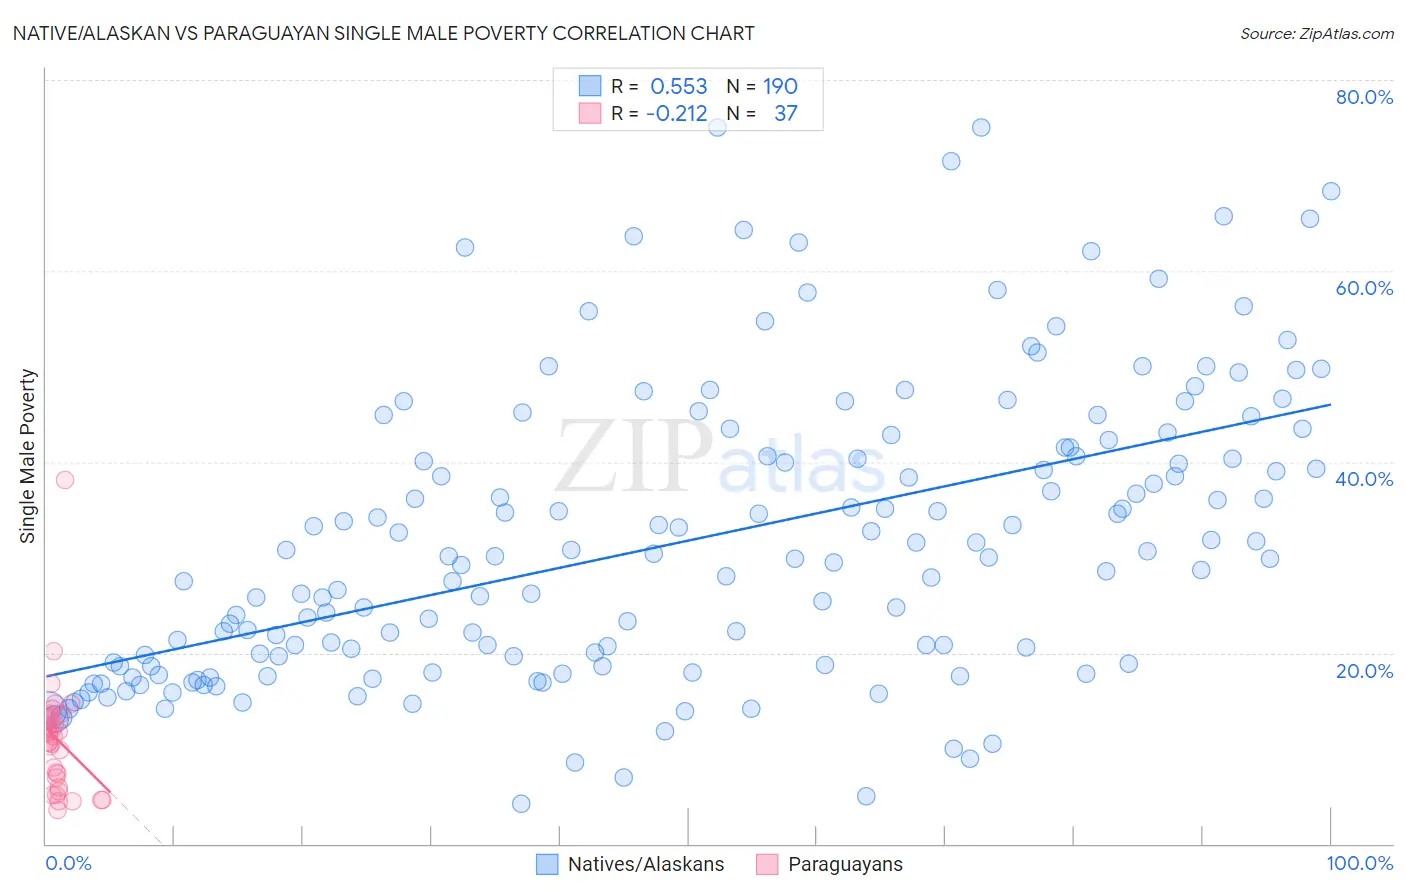
Native/Alaskan vs Paraguayan Single Male Poverty Correlation Chart
The statistical analysis conducted on geographies consisting of 444,255,067 people shows a substantial positive correlation between the proportion of Natives/Alaskans and poverty level among single males in the United States with a correlation coefficient (R) of 0.553 and weighted average of 19.6%. Similarly, the statistical analysis conducted on geographies consisting of 90,716,103 people shows a weak negative correlation between the proportion of Paraguayans and poverty level among single males in the United States with a correlation coefficient (R) of -0.212 and weighted average of 11.6%, a difference of 68.8%.
Single Male Poverty Correlation Summary
| Measurement | Native/Alaskan | Paraguayan |
| Minimum | 4.3% | 3.6% |
| Maximum | 75.0% | 38.1% |
| Range | 70.7% | 34.5% |
| Mean | 31.7% | 10.9% |
| Median | 29.9% | 11.3% |
| Interquartile 25% (IQ1) | 18.7% | 6.4% |
| Interquartile 75% (IQ3) | 41.5% | 13.2% |
| Interquartile Range (IQR) | 22.8% | 6.8% |
| Standard Deviation (Sample) | 15.2% | 6.1% |
| Standard Deviation (Population) | 15.2% | 6.0% |
Similar Demographics by Single Male Poverty
Demographics Similar to Natives/Alaskans by Single Male Poverty
In terms of single male poverty, the demographic groups most similar to Natives/Alaskans are Paiute (19.3%, a difference of 1.7%), Inupiat (20.0%, a difference of 1.9%), Pima (20.2%, a difference of 2.7%), Cajun (19.1%, a difference of 2.8%), and Colville (18.4%, a difference of 6.4%).
| Demographics | Rating | Rank | Single Male Poverty |
| Choctaw | 0.0 /100 | #325 | Tragic 17.0% |
| Central American Indians | 0.0 /100 | #326 | Tragic 17.2% |
| Menominee | 0.0 /100 | #327 | Tragic 17.7% |
| Kiowa | 0.0 /100 | #328 | Tragic 18.3% |
| Colville | 0.0 /100 | #329 | Tragic 18.4% |
| Cajuns | 0.0 /100 | #330 | Tragic 19.1% |
| Paiute | 0.0 /100 | #331 | Tragic 19.3% |
| Natives/Alaskans | 0.0 /100 | #332 | Tragic 19.6% |
| Inupiat | 0.0 /100 | #333 | Tragic 20.0% |
| Pima | 0.0 /100 | #334 | Tragic 20.2% |
| Yuman | 0.0 /100 | #335 | Tragic 21.3% |
| Tohono O'odham | 0.0 /100 | #336 | Tragic 21.6% |
| Apache | 0.0 /100 | #337 | Tragic 21.6% |
| Pueblo | 0.0 /100 | #338 | Tragic 21.6% |
| Arapaho | 0.0 /100 | #339 | Tragic 21.9% |
Demographics Similar to Paraguayans by Single Male Poverty
In terms of single male poverty, the demographic groups most similar to Paraguayans are Immigrants from Lithuania (11.6%, a difference of 0.11%), Tlingit-Haida (11.6%, a difference of 0.17%), Immigrants from Indonesia (11.6%, a difference of 0.19%), Nepalese (11.6%, a difference of 0.26%), and Samoan (11.7%, a difference of 0.31%).
| Demographics | Rating | Rank | Single Male Poverty |
| Immigrants | Cameroon | 99.9 /100 | #44 | Exceptional 11.5% |
| Immigrants | Poland | 99.9 /100 | #45 | Exceptional 11.5% |
| Immigrants | Bulgaria | 99.9 /100 | #46 | Exceptional 11.6% |
| Nepalese | 99.9 /100 | #47 | Exceptional 11.6% |
| Immigrants | Indonesia | 99.9 /100 | #48 | Exceptional 11.6% |
| Tlingit-Haida | 99.9 /100 | #49 | Exceptional 11.6% |
| Immigrants | Lithuania | 99.9 /100 | #50 | Exceptional 11.6% |
| Paraguayans | 99.9 /100 | #51 | Exceptional 11.6% |
| Samoans | 99.9 /100 | #52 | Exceptional 11.7% |
| Bulgarians | 99.9 /100 | #53 | Exceptional 11.7% |
| Immigrants | Uzbekistan | 99.9 /100 | #54 | Exceptional 11.7% |
| Cypriots | 99.9 /100 | #55 | Exceptional 11.7% |
| Burmese | 99.8 /100 | #56 | Exceptional 11.7% |
| Immigrants | Romania | 99.8 /100 | #57 | Exceptional 11.7% |
| Immigrants | Brazil | 99.8 /100 | #58 | Exceptional 11.7% |