Immigrants from Guatemala vs Immigrants from Hong Kong Married-Couple Family Poverty
COMPARE
Immigrants from Guatemala
Immigrants from Hong Kong
Married-Couple Family Poverty
Married-Couple Family Poverty Comparison
Immigrants from Guatemala
Immigrants from Hong Kong
7.2%
MARRIED-COUPLE FAMILY POVERTY
0.0/ 100
METRIC RATING
318th/ 347
METRIC RANK
4.7%
MARRIED-COUPLE FAMILY POVERTY
96.4/ 100
METRIC RATING
109th/ 347
METRIC RANK
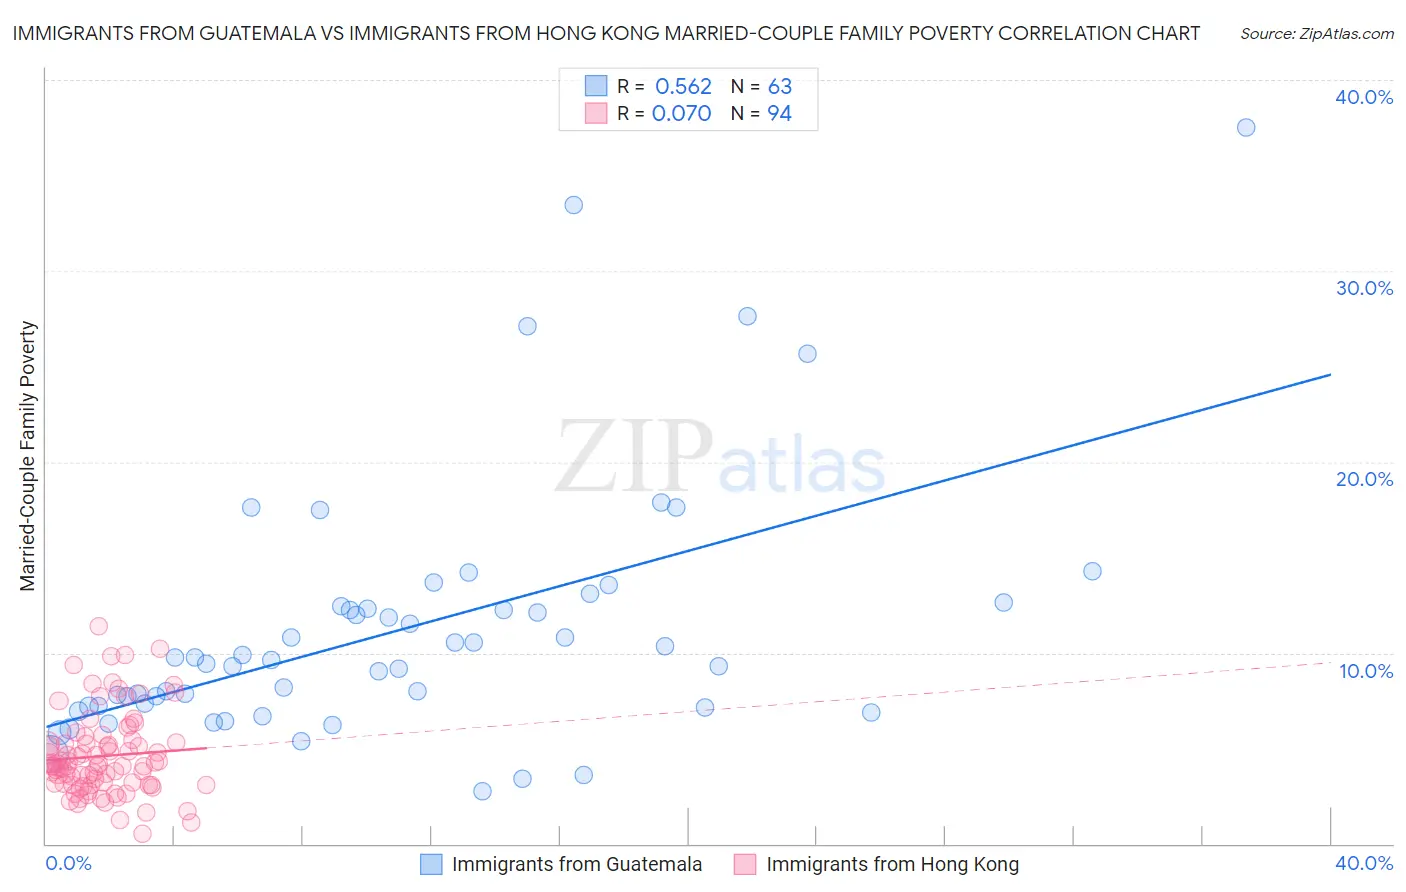
Immigrants from Guatemala vs Immigrants from Hong Kong Married-Couple Family Poverty Correlation Chart
The statistical analysis conducted on geographies consisting of 375,097,244 people shows a substantial positive correlation between the proportion of Immigrants from Guatemala and poverty level among married-couple families in the United States with a correlation coefficient (R) of 0.562 and weighted average of 7.2%. Similarly, the statistical analysis conducted on geographies consisting of 252,495,550 people shows a slight positive correlation between the proportion of Immigrants from Hong Kong and poverty level among married-couple families in the United States with a correlation coefficient (R) of 0.070 and weighted average of 4.7%, a difference of 52.3%.
Married-Couple Family Poverty Correlation Summary
| Measurement | Immigrants from Guatemala | Immigrants from Hong Kong |
| Minimum | 2.7% | 0.53% |
| Maximum | 37.5% | 11.4% |
| Range | 34.8% | 10.8% |
| Mean | 11.2% | 4.6% |
| Median | 9.6% | 4.1% |
| Interquartile 25% (IQ1) | 7.2% | 3.1% |
| Interquartile 75% (IQ3) | 12.5% | 5.3% |
| Interquartile Range (IQR) | 5.3% | 2.2% |
| Standard Deviation (Sample) | 6.7% | 2.2% |
| Standard Deviation (Population) | 6.6% | 2.1% |
Similar Demographics by Married-Couple Family Poverty
Demographics Similar to Immigrants from Guatemala by Married-Couple Family Poverty
In terms of married-couple family poverty, the demographic groups most similar to Immigrants from Guatemala are Mexican (7.2%, a difference of 0.17%), Immigrants from Latin America (7.2%, a difference of 0.17%), Honduran (7.2%, a difference of 0.48%), Inupiat (7.1%, a difference of 0.63%), and British West Indian (7.1%, a difference of 0.87%).
| Demographics | Rating | Rank | Married-Couple Family Poverty |
| Immigrants | Dominica | 0.0 /100 | #311 | Tragic 7.1% |
| Immigrants | Armenia | 0.0 /100 | #312 | Tragic 7.1% |
| Immigrants | St. Vincent and the Grenadines | 0.0 /100 | #313 | Tragic 7.1% |
| British West Indians | 0.0 /100 | #314 | Tragic 7.1% |
| Inupiat | 0.0 /100 | #315 | Tragic 7.1% |
| Hondurans | 0.0 /100 | #316 | Tragic 7.2% |
| Mexicans | 0.0 /100 | #317 | Tragic 7.2% |
| Immigrants | Guatemala | 0.0 /100 | #318 | Tragic 7.2% |
| Immigrants | Latin America | 0.0 /100 | #319 | Tragic 7.2% |
| Immigrants | Grenada | 0.0 /100 | #320 | Tragic 7.3% |
| Immigrants | Caribbean | 0.0 /100 | #321 | Tragic 7.3% |
| Immigrants | Honduras | 0.0 /100 | #322 | Tragic 7.3% |
| Vietnamese | 0.0 /100 | #323 | Tragic 7.4% |
| Immigrants | Central America | 0.0 /100 | #324 | Tragic 7.4% |
| Immigrants | Cuba | 0.0 /100 | #325 | Tragic 7.5% |
Demographics Similar to Immigrants from Hong Kong by Married-Couple Family Poverty
In terms of married-couple family poverty, the demographic groups most similar to Immigrants from Hong Kong are Immigrants from Bolivia (4.7%, a difference of 0.16%), Laotian (4.7%, a difference of 0.20%), Pakistani (4.7%, a difference of 0.20%), Tongan (4.7%, a difference of 0.38%), and Immigrants from Nepal (4.7%, a difference of 0.45%).
| Demographics | Rating | Rank | Married-Couple Family Poverty |
| Asians | 97.6 /100 | #102 | Exceptional 4.7% |
| Immigrants | Romania | 97.3 /100 | #103 | Exceptional 4.7% |
| Immigrants | Moldova | 97.1 /100 | #104 | Exceptional 4.7% |
| Aleuts | 97.0 /100 | #105 | Exceptional 4.7% |
| Immigrants | France | 96.9 /100 | #106 | Exceptional 4.7% |
| Immigrants | Germany | 96.8 /100 | #107 | Exceptional 4.7% |
| Laotians | 96.6 /100 | #108 | Exceptional 4.7% |
| Immigrants | Hong Kong | 96.4 /100 | #109 | Exceptional 4.7% |
| Immigrants | Bolivia | 96.2 /100 | #110 | Exceptional 4.7% |
| Pakistanis | 96.2 /100 | #111 | Exceptional 4.7% |
| Tongans | 95.9 /100 | #112 | Exceptional 4.7% |
| Immigrants | Nepal | 95.9 /100 | #113 | Exceptional 4.7% |
| Immigrants | Indonesia | 95.1 /100 | #114 | Exceptional 4.8% |
| Taiwanese | 94.8 /100 | #115 | Exceptional 4.8% |
| Celtics | 94.8 /100 | #116 | Exceptional 4.8% |