Immigrants from Israel vs Immigrants from Hong Kong Married-Couple Family Poverty
COMPARE
Immigrants from Israel
Immigrants from Hong Kong
Married-Couple Family Poverty
Married-Couple Family Poverty Comparison
Immigrants from Israel
Immigrants from Hong Kong
5.4%
MARRIED-COUPLE FAMILY POVERTY
27.8/ 100
METRIC RATING
194th/ 347
METRIC RANK
4.7%
MARRIED-COUPLE FAMILY POVERTY
96.4/ 100
METRIC RATING
109th/ 347
METRIC RANK
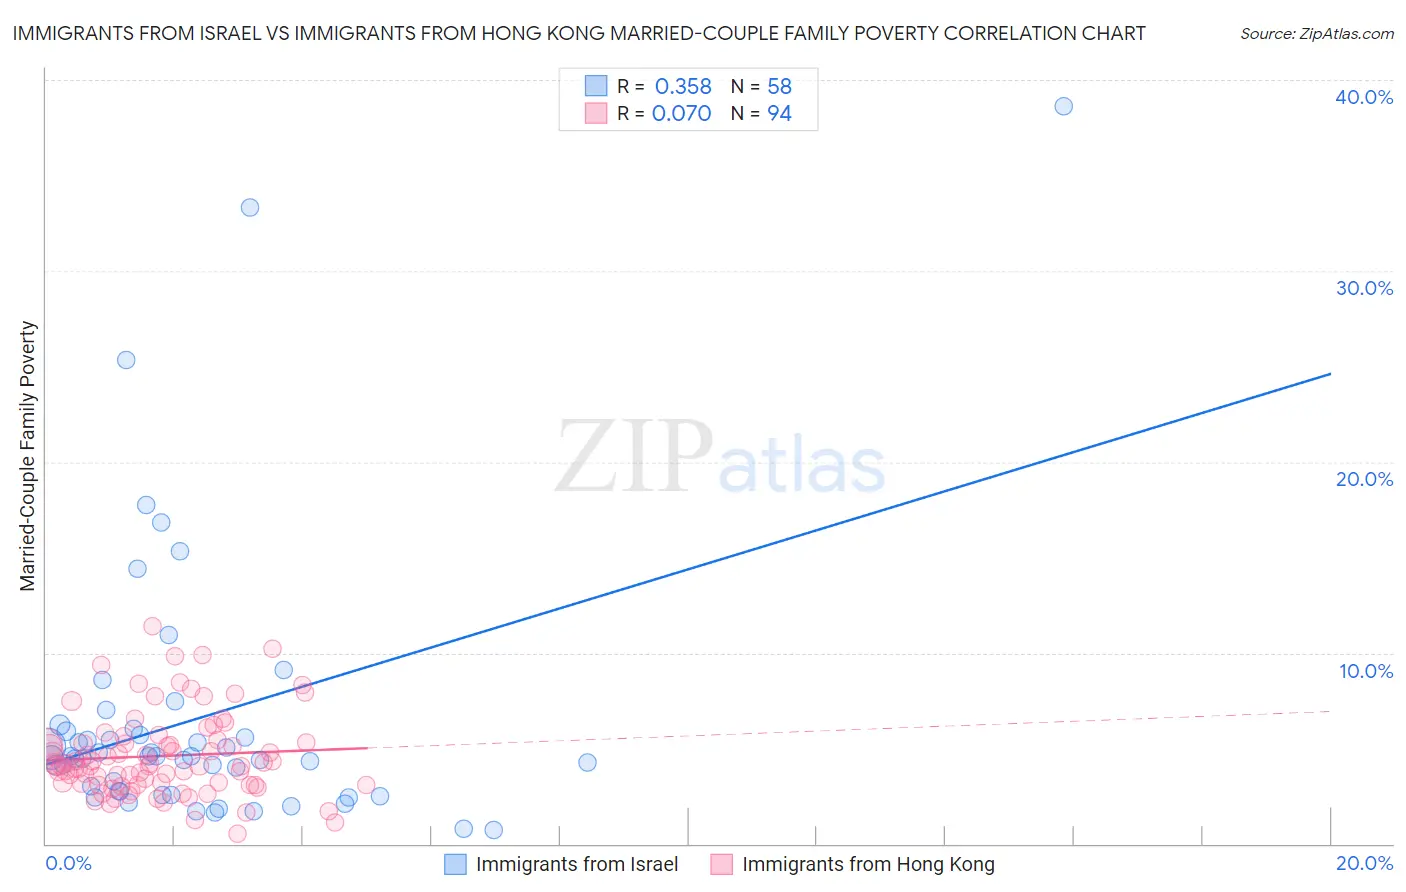
Immigrants from Israel vs Immigrants from Hong Kong Married-Couple Family Poverty Correlation Chart
The statistical analysis conducted on geographies consisting of 209,060,562 people shows a mild positive correlation between the proportion of Immigrants from Israel and poverty level among married-couple families in the United States with a correlation coefficient (R) of 0.358 and weighted average of 5.4%. Similarly, the statistical analysis conducted on geographies consisting of 252,495,550 people shows a slight positive correlation between the proportion of Immigrants from Hong Kong and poverty level among married-couple families in the United States with a correlation coefficient (R) of 0.070 and weighted average of 4.7%, a difference of 13.6%.
Married-Couple Family Poverty Correlation Summary
| Measurement | Immigrants from Israel | Immigrants from Hong Kong |
| Minimum | 0.74% | 0.53% |
| Maximum | 38.6% | 11.4% |
| Range | 37.9% | 10.8% |
| Mean | 6.5% | 4.6% |
| Median | 4.5% | 4.1% |
| Interquartile 25% (IQ1) | 2.7% | 3.1% |
| Interquartile 75% (IQ3) | 5.9% | 5.3% |
| Interquartile Range (IQR) | 3.2% | 2.2% |
| Standard Deviation (Sample) | 7.2% | 2.2% |
| Standard Deviation (Population) | 7.1% | 2.1% |
Similar Demographics by Married-Couple Family Poverty
Demographics Similar to Immigrants from Israel by Married-Couple Family Poverty
In terms of married-couple family poverty, the demographic groups most similar to Immigrants from Israel are Immigrants from the Azores (5.4%, a difference of 0.040%), Spaniard (5.4%, a difference of 0.060%), Malaysian (5.4%, a difference of 0.22%), Liberian (5.4%, a difference of 0.22%), and Immigrants from Belarus (5.4%, a difference of 0.24%).
| Demographics | Rating | Rank | Married-Couple Family Poverty |
| Immigrants | Albania | 33.8 /100 | #187 | Fair 5.3% |
| Israelis | 33.1 /100 | #188 | Fair 5.3% |
| South American Indians | 32.5 /100 | #189 | Fair 5.3% |
| Ugandans | 31.6 /100 | #190 | Fair 5.3% |
| Immigrants | Cabo Verde | 30.9 /100 | #191 | Fair 5.3% |
| Cape Verdeans | 30.7 /100 | #192 | Fair 5.3% |
| Malaysians | 29.5 /100 | #193 | Fair 5.4% |
| Immigrants | Israel | 27.8 /100 | #194 | Fair 5.4% |
| Immigrants | Azores | 27.5 /100 | #195 | Fair 5.4% |
| Spaniards | 27.4 /100 | #196 | Fair 5.4% |
| Liberians | 26.3 /100 | #197 | Fair 5.4% |
| Immigrants | Belarus | 26.2 /100 | #198 | Fair 5.4% |
| Uruguayans | 25.0 /100 | #199 | Fair 5.4% |
| Immigrants | Morocco | 24.3 /100 | #200 | Fair 5.4% |
| Lebanese | 24.1 /100 | #201 | Fair 5.4% |
Demographics Similar to Immigrants from Hong Kong by Married-Couple Family Poverty
In terms of married-couple family poverty, the demographic groups most similar to Immigrants from Hong Kong are Immigrants from Bolivia (4.7%, a difference of 0.16%), Laotian (4.7%, a difference of 0.20%), Pakistani (4.7%, a difference of 0.20%), Tongan (4.7%, a difference of 0.38%), and Immigrants from Nepal (4.7%, a difference of 0.45%).
| Demographics | Rating | Rank | Married-Couple Family Poverty |
| Asians | 97.6 /100 | #102 | Exceptional 4.7% |
| Immigrants | Romania | 97.3 /100 | #103 | Exceptional 4.7% |
| Immigrants | Moldova | 97.1 /100 | #104 | Exceptional 4.7% |
| Aleuts | 97.0 /100 | #105 | Exceptional 4.7% |
| Immigrants | France | 96.9 /100 | #106 | Exceptional 4.7% |
| Immigrants | Germany | 96.8 /100 | #107 | Exceptional 4.7% |
| Laotians | 96.6 /100 | #108 | Exceptional 4.7% |
| Immigrants | Hong Kong | 96.4 /100 | #109 | Exceptional 4.7% |
| Immigrants | Bolivia | 96.2 /100 | #110 | Exceptional 4.7% |
| Pakistanis | 96.2 /100 | #111 | Exceptional 4.7% |
| Tongans | 95.9 /100 | #112 | Exceptional 4.7% |
| Immigrants | Nepal | 95.9 /100 | #113 | Exceptional 4.7% |
| Immigrants | Indonesia | 95.1 /100 | #114 | Exceptional 4.8% |
| Taiwanese | 94.8 /100 | #115 | Exceptional 4.8% |
| Celtics | 94.8 /100 | #116 | Exceptional 4.8% |