Belizean vs Immigrants from Hong Kong Married-Couple Family Poverty
COMPARE
Belizean
Immigrants from Hong Kong
Married-Couple Family Poverty
Married-Couple Family Poverty Comparison
Belizeans
Immigrants from Hong Kong
6.5%
MARRIED-COUPLE FAMILY POVERTY
0.0/ 100
METRIC RATING
291st/ 347
METRIC RANK
4.7%
MARRIED-COUPLE FAMILY POVERTY
96.4/ 100
METRIC RATING
109th/ 347
METRIC RANK
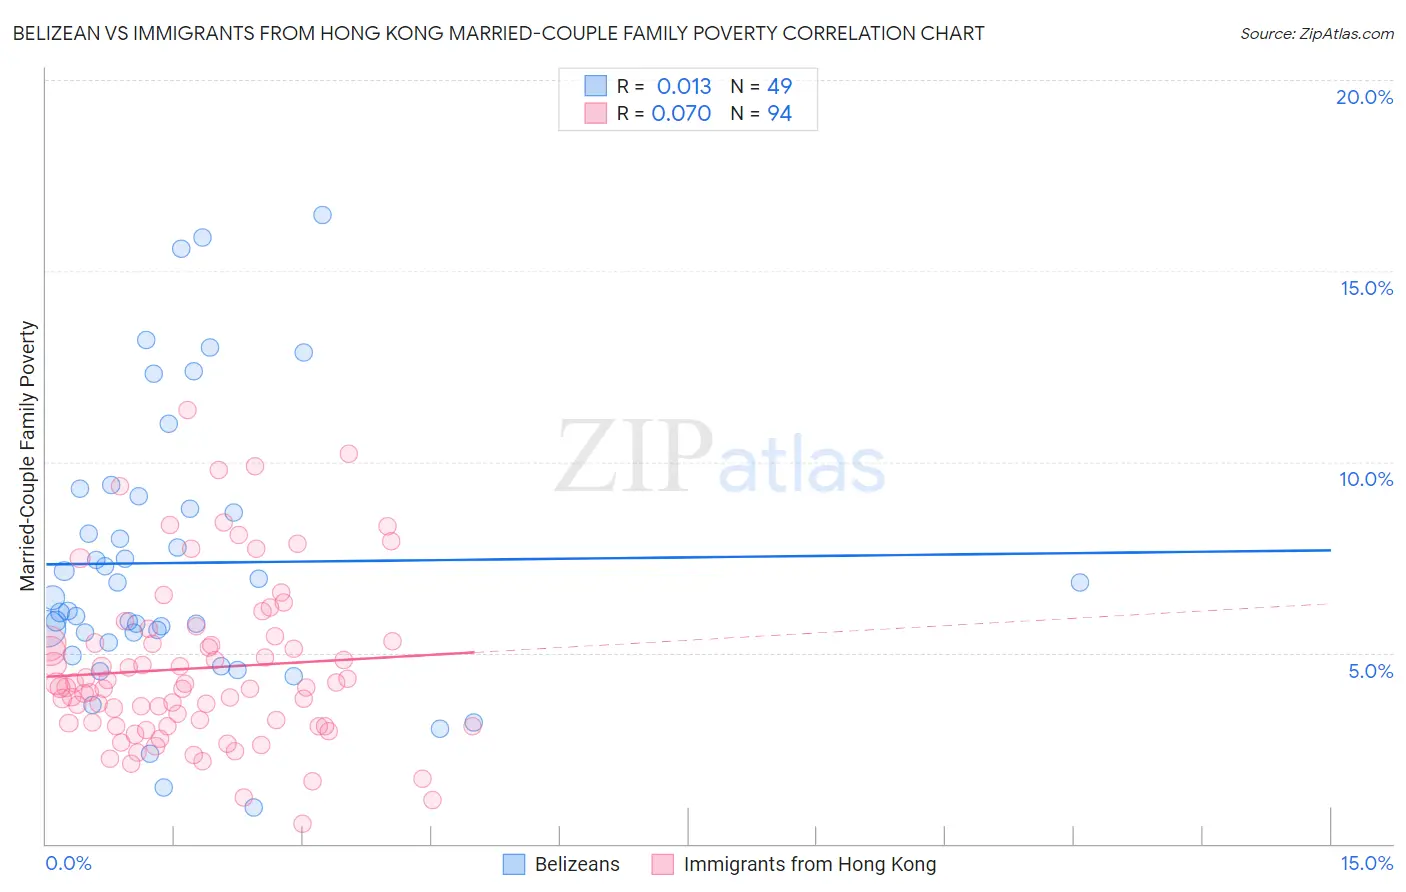
Belizean vs Immigrants from Hong Kong Married-Couple Family Poverty Correlation Chart
The statistical analysis conducted on geographies consisting of 143,932,988 people shows no correlation between the proportion of Belizeans and poverty level among married-couple families in the United States with a correlation coefficient (R) of 0.013 and weighted average of 6.5%. Similarly, the statistical analysis conducted on geographies consisting of 252,495,550 people shows a slight positive correlation between the proportion of Immigrants from Hong Kong and poverty level among married-couple families in the United States with a correlation coefficient (R) of 0.070 and weighted average of 4.7%, a difference of 38.7%.
Married-Couple Family Poverty Correlation Summary
| Measurement | Belizean | Immigrants from Hong Kong |
| Minimum | 0.96% | 0.53% |
| Maximum | 16.5% | 11.4% |
| Range | 15.5% | 10.8% |
| Mean | 7.4% | 4.6% |
| Median | 6.5% | 4.1% |
| Interquartile 25% (IQ1) | 5.4% | 3.1% |
| Interquartile 75% (IQ3) | 8.9% | 5.3% |
| Interquartile Range (IQR) | 3.5% | 2.2% |
| Standard Deviation (Sample) | 3.6% | 2.2% |
| Standard Deviation (Population) | 3.6% | 2.1% |
Similar Demographics by Married-Couple Family Poverty
Demographics Similar to Belizeans by Married-Couple Family Poverty
In terms of married-couple family poverty, the demographic groups most similar to Belizeans are Immigrants from Barbados (6.5%, a difference of 0.040%), Immigrants from Lebanon (6.6%, a difference of 0.17%), Nepalese (6.5%, a difference of 0.26%), Arapaho (6.6%, a difference of 0.26%), and Salvadoran (6.5%, a difference of 0.44%).
| Demographics | Rating | Rank | Married-Couple Family Poverty |
| Dutch West Indians | 0.0 /100 | #284 | Tragic 6.4% |
| Blacks/African Americans | 0.0 /100 | #285 | Tragic 6.5% |
| Guyanese | 0.0 /100 | #286 | Tragic 6.5% |
| Ecuadorians | 0.0 /100 | #287 | Tragic 6.5% |
| Salvadorans | 0.0 /100 | #288 | Tragic 6.5% |
| Nepalese | 0.0 /100 | #289 | Tragic 6.5% |
| Immigrants | Barbados | 0.0 /100 | #290 | Tragic 6.5% |
| Belizeans | 0.0 /100 | #291 | Tragic 6.5% |
| Immigrants | Lebanon | 0.0 /100 | #292 | Tragic 6.6% |
| Arapaho | 0.0 /100 | #293 | Tragic 6.6% |
| Bahamians | 0.0 /100 | #294 | Tragic 6.6% |
| Immigrants | Uzbekistan | 0.0 /100 | #295 | Tragic 6.6% |
| U.S. Virgin Islanders | 0.0 /100 | #296 | Tragic 6.6% |
| Kiowa | 0.0 /100 | #297 | Tragic 6.6% |
| Immigrants | Guyana | 0.0 /100 | #298 | Tragic 6.7% |
Demographics Similar to Immigrants from Hong Kong by Married-Couple Family Poverty
In terms of married-couple family poverty, the demographic groups most similar to Immigrants from Hong Kong are Immigrants from Bolivia (4.7%, a difference of 0.16%), Laotian (4.7%, a difference of 0.20%), Pakistani (4.7%, a difference of 0.20%), Tongan (4.7%, a difference of 0.38%), and Immigrants from Nepal (4.7%, a difference of 0.45%).
| Demographics | Rating | Rank | Married-Couple Family Poverty |
| Asians | 97.6 /100 | #102 | Exceptional 4.7% |
| Immigrants | Romania | 97.3 /100 | #103 | Exceptional 4.7% |
| Immigrants | Moldova | 97.1 /100 | #104 | Exceptional 4.7% |
| Aleuts | 97.0 /100 | #105 | Exceptional 4.7% |
| Immigrants | France | 96.9 /100 | #106 | Exceptional 4.7% |
| Immigrants | Germany | 96.8 /100 | #107 | Exceptional 4.7% |
| Laotians | 96.6 /100 | #108 | Exceptional 4.7% |
| Immigrants | Hong Kong | 96.4 /100 | #109 | Exceptional 4.7% |
| Immigrants | Bolivia | 96.2 /100 | #110 | Exceptional 4.7% |
| Pakistanis | 96.2 /100 | #111 | Exceptional 4.7% |
| Tongans | 95.9 /100 | #112 | Exceptional 4.7% |
| Immigrants | Nepal | 95.9 /100 | #113 | Exceptional 4.7% |
| Immigrants | Indonesia | 95.1 /100 | #114 | Exceptional 4.8% |
| Taiwanese | 94.8 /100 | #115 | Exceptional 4.8% |
| Celtics | 94.8 /100 | #116 | Exceptional 4.8% |