Jamaican vs Immigrants from Czechoslovakia Male Disability
COMPARE
Jamaican
Immigrants from Czechoslovakia
Male Disability
Male Disability Comparison
Jamaicans
Immigrants from Czechoslovakia
11.5%
MALE DISABILITY
10.9/ 100
METRIC RATING
203rd/ 347
METRIC RANK
10.9%
MALE DISABILITY
88.4/ 100
METRIC RATING
123rd/ 347
METRIC RANK
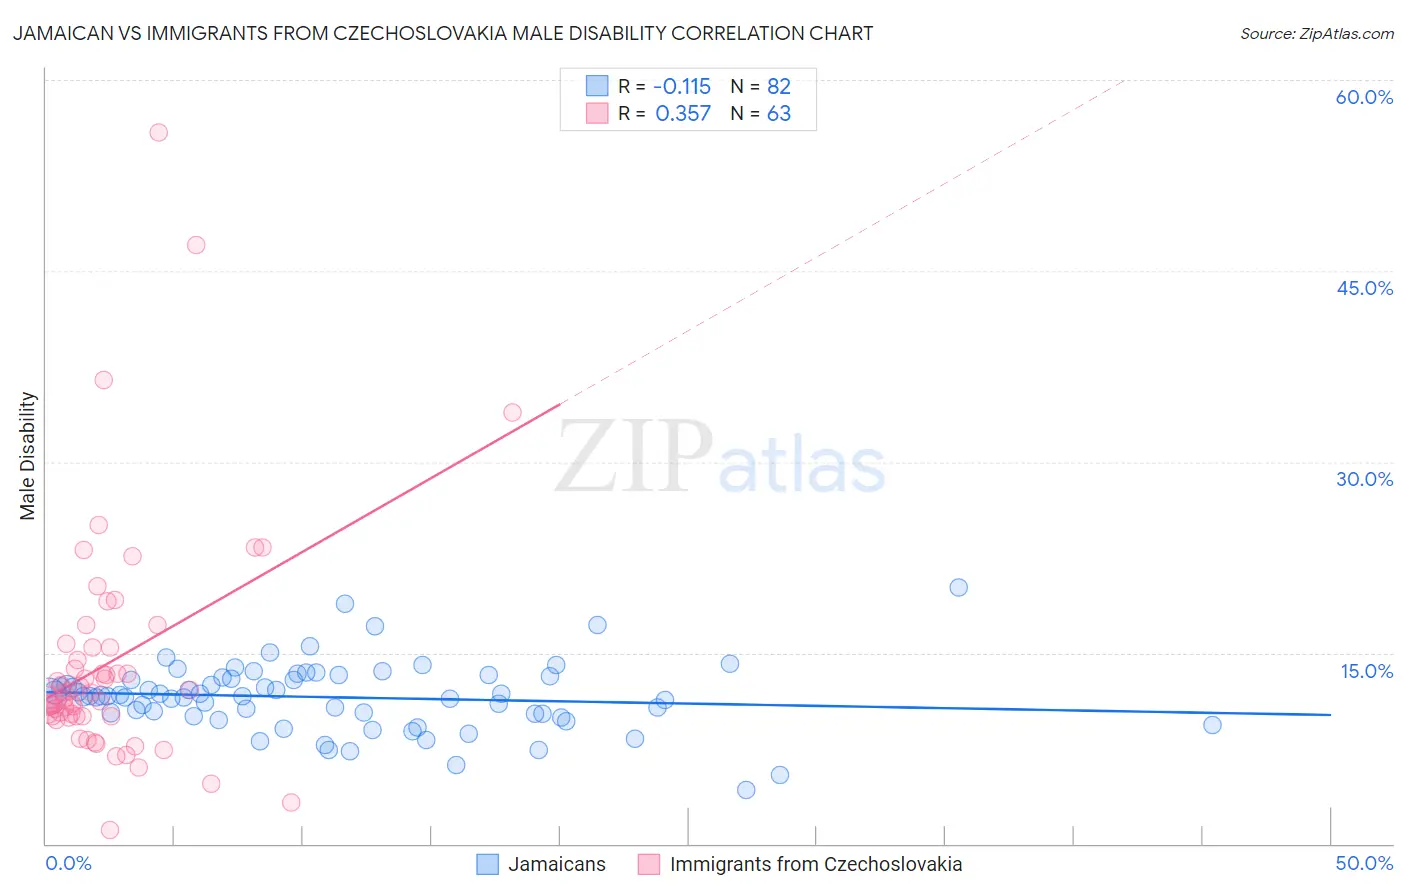
Jamaican vs Immigrants from Czechoslovakia Male Disability Correlation Chart
The statistical analysis conducted on geographies consisting of 367,937,563 people shows a poor negative correlation between the proportion of Jamaicans and percentage of males with a disability in the United States with a correlation coefficient (R) of -0.115 and weighted average of 11.5%. Similarly, the statistical analysis conducted on geographies consisting of 195,455,879 people shows a mild positive correlation between the proportion of Immigrants from Czechoslovakia and percentage of males with a disability in the United States with a correlation coefficient (R) of 0.357 and weighted average of 10.9%, a difference of 5.9%.
Male Disability Correlation Summary
| Measurement | Jamaican | Immigrants from Czechoslovakia |
| Minimum | 4.2% | 1.1% |
| Maximum | 20.1% | 55.9% |
| Range | 15.9% | 54.9% |
| Mean | 11.5% | 14.3% |
| Median | 11.6% | 11.9% |
| Interquartile 25% (IQ1) | 10.2% | 10.0% |
| Interquartile 75% (IQ3) | 13.1% | 15.5% |
| Interquartile Range (IQR) | 2.9% | 5.4% |
| Standard Deviation (Sample) | 2.7% | 9.3% |
| Standard Deviation (Population) | 2.7% | 9.2% |
Similar Demographics by Male Disability
Demographics Similar to Jamaicans by Male Disability
In terms of male disability, the demographic groups most similar to Jamaicans are Immigrants from Cambodia (11.5%, a difference of 0.010%), Serbian (11.5%, a difference of 0.020%), Ukrainian (11.5%, a difference of 0.030%), Immigrants from Somalia (11.5%, a difference of 0.060%), and Icelander (11.6%, a difference of 0.10%).
| Demographics | Rating | Rank | Male Disability |
| West Indians | 18.4 /100 | #196 | Poor 11.4% |
| Somalis | 18.2 /100 | #197 | Poor 11.4% |
| Immigrants | Jamaica | 16.3 /100 | #198 | Poor 11.5% |
| Lebanese | 15.4 /100 | #199 | Poor 11.5% |
| Immigrants | Iraq | 13.0 /100 | #200 | Poor 11.5% |
| Immigrants | Panama | 13.0 /100 | #201 | Poor 11.5% |
| Immigrants | Mexico | 12.6 /100 | #202 | Poor 11.5% |
| Jamaicans | 10.9 /100 | #203 | Poor 11.5% |
| Immigrants | Cambodia | 10.8 /100 | #204 | Poor 11.5% |
| Serbians | 10.7 /100 | #205 | Poor 11.5% |
| Ukrainians | 10.6 /100 | #206 | Poor 11.5% |
| Immigrants | Somalia | 10.4 /100 | #207 | Poor 11.5% |
| Icelanders | 10.1 /100 | #208 | Poor 11.6% |
| Spanish American Indians | 10.1 /100 | #209 | Poor 11.6% |
| Ute | 9.4 /100 | #210 | Tragic 11.6% |
Demographics Similar to Immigrants from Czechoslovakia by Male Disability
In terms of male disability, the demographic groups most similar to Immigrants from Czechoslovakia are South American Indian (10.9%, a difference of 0.040%), Immigrants from North Macedonia (10.9%, a difference of 0.040%), Immigrants from Ghana (10.9%, a difference of 0.090%), Immigrants from South Eastern Asia (10.9%, a difference of 0.11%), and Immigrants from Africa (10.9%, a difference of 0.15%).
| Demographics | Rating | Rank | Male Disability |
| Immigrants | South Africa | 91.8 /100 | #116 | Exceptional 10.8% |
| Eastern Europeans | 90.6 /100 | #117 | Exceptional 10.9% |
| Immigrants | Cuba | 90.2 /100 | #118 | Exceptional 10.9% |
| Armenians | 90.1 /100 | #119 | Exceptional 10.9% |
| Immigrants | Africa | 89.4 /100 | #120 | Excellent 10.9% |
| Immigrants | South Eastern Asia | 89.2 /100 | #121 | Excellent 10.9% |
| Immigrants | Ghana | 89.0 /100 | #122 | Excellent 10.9% |
| Immigrants | Czechoslovakia | 88.4 /100 | #123 | Excellent 10.9% |
| South American Indians | 88.1 /100 | #124 | Excellent 10.9% |
| Immigrants | North Macedonia | 88.1 /100 | #125 | Excellent 10.9% |
| Immigrants | Trinidad and Tobago | 86.9 /100 | #126 | Excellent 10.9% |
| Immigrants | Ukraine | 86.8 /100 | #127 | Excellent 10.9% |
| Immigrants | Latvia | 85.5 /100 | #128 | Excellent 10.9% |
| Immigrants | Philippines | 85.4 /100 | #129 | Excellent 10.9% |
| Brazilians | 85.4 /100 | #130 | Excellent 10.9% |