Jamaican vs Afghan 3 or more Vehicles in Household
COMPARE
Jamaican
Afghan
3 or more Vehicles in Household
3 or more Vehicles in Household Comparison
Jamaicans
Afghans
15.2%
3 OR MORE VEHICLES IN HOUSEHOLD
0.0/ 100
METRIC RATING
317th/ 347
METRIC RANK
21.7%
3 OR MORE VEHICLES IN HOUSEHOLD
99.7/ 100
METRIC RATING
80th/ 347
METRIC RANK
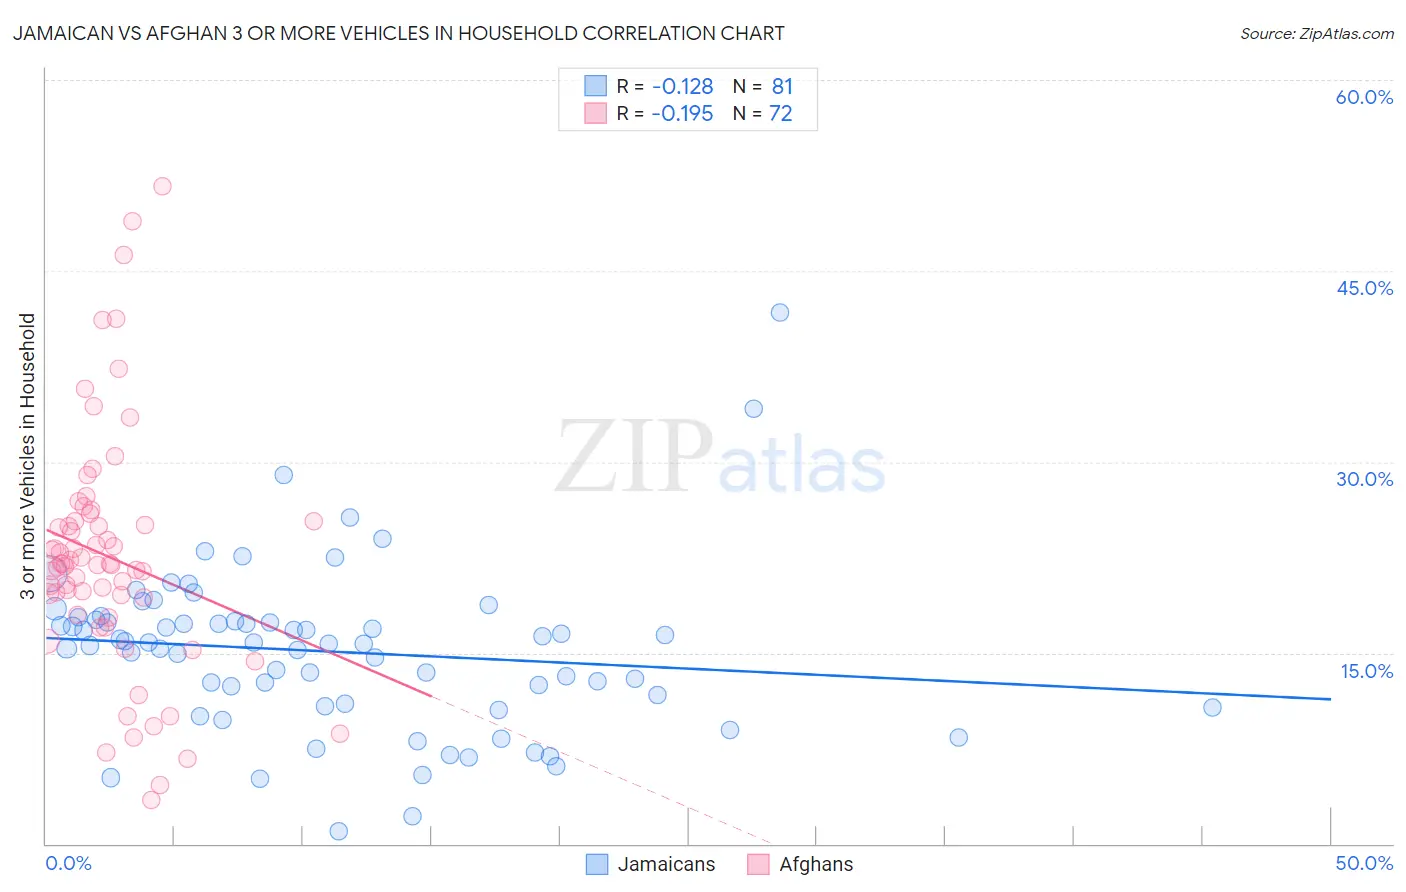
Jamaican vs Afghan 3 or more Vehicles in Household Correlation Chart
The statistical analysis conducted on geographies consisting of 367,542,736 people shows a poor negative correlation between the proportion of Jamaicans and percentage of households with 3 or more vehicles available in the United States with a correlation coefficient (R) of -0.128 and weighted average of 15.2%. Similarly, the statistical analysis conducted on geographies consisting of 148,806,002 people shows a poor negative correlation between the proportion of Afghans and percentage of households with 3 or more vehicles available in the United States with a correlation coefficient (R) of -0.195 and weighted average of 21.7%, a difference of 42.5%.
3 or more Vehicles in Household Correlation Summary
| Measurement | Jamaican | Afghan |
| Minimum | 0.94% | 3.4% |
| Maximum | 41.8% | 51.7% |
| Range | 40.8% | 48.3% |
| Mean | 15.1% | 22.5% |
| Median | 15.7% | 21.9% |
| Interquartile 25% (IQ1) | 10.9% | 18.6% |
| Interquartile 75% (IQ3) | 17.6% | 25.3% |
| Interquartile Range (IQR) | 6.7% | 6.7% |
| Standard Deviation (Sample) | 6.5% | 9.4% |
| Standard Deviation (Population) | 6.4% | 9.4% |
Similar Demographics by 3 or more Vehicles in Household
Demographics Similar to Jamaicans by 3 or more Vehicles in Household
In terms of 3 or more vehicles in household, the demographic groups most similar to Jamaicans are Immigrants from Haiti (15.2%, a difference of 0.20%), U.S. Virgin Islander (15.4%, a difference of 1.2%), Cape Verdean (15.0%, a difference of 1.4%), Haitian (15.5%, a difference of 1.7%), and Immigrants from Belarus (15.5%, a difference of 2.0%).
| Demographics | Rating | Rank | 3 or more Vehicles in Household |
| Moroccans | 0.0 /100 | #310 | Tragic 15.9% |
| Albanians | 0.0 /100 | #311 | Tragic 15.8% |
| Puerto Ricans | 0.0 /100 | #312 | Tragic 15.6% |
| Immigrants | Israel | 0.0 /100 | #313 | Tragic 15.6% |
| Immigrants | Belarus | 0.0 /100 | #314 | Tragic 15.5% |
| Haitians | 0.0 /100 | #315 | Tragic 15.5% |
| U.S. Virgin Islanders | 0.0 /100 | #316 | Tragic 15.4% |
| Jamaicans | 0.0 /100 | #317 | Tragic 15.2% |
| Immigrants | Haiti | 0.0 /100 | #318 | Tragic 15.2% |
| Cape Verdeans | 0.0 /100 | #319 | Tragic 15.0% |
| Yup'ik | 0.0 /100 | #320 | Tragic 14.8% |
| Immigrants | Jamaica | 0.0 /100 | #321 | Tragic 14.7% |
| Immigrants | West Indies | 0.0 /100 | #322 | Tragic 14.6% |
| Immigrants | Caribbean | 0.0 /100 | #323 | Tragic 14.6% |
| Immigrants | Yemen | 0.0 /100 | #324 | Tragic 14.2% |
Demographics Similar to Afghans by 3 or more Vehicles in Household
In terms of 3 or more vehicles in household, the demographic groups most similar to Afghans are Celtic (21.7%, a difference of 0.070%), Assyrian/Chaldean/Syriac (21.7%, a difference of 0.20%), Czechoslovakian (21.7%, a difference of 0.21%), Irish (21.8%, a difference of 0.34%), and Nonimmigrants (21.8%, a difference of 0.41%).
| Demographics | Rating | Rank | 3 or more Vehicles in Household |
| Salvadorans | 99.8 /100 | #73 | Exceptional 21.8% |
| Immigrants | Oceania | 99.8 /100 | #74 | Exceptional 21.8% |
| Japanese | 99.8 /100 | #75 | Exceptional 21.8% |
| Immigrants | Nonimmigrants | 99.8 /100 | #76 | Exceptional 21.8% |
| Irish | 99.8 /100 | #77 | Exceptional 21.8% |
| Czechoslovakians | 99.8 /100 | #78 | Exceptional 21.7% |
| Assyrians/Chaldeans/Syriacs | 99.8 /100 | #79 | Exceptional 21.7% |
| Afghans | 99.7 /100 | #80 | Exceptional 21.7% |
| Celtics | 99.7 /100 | #81 | Exceptional 21.7% |
| Immigrants | El Salvador | 99.6 /100 | #82 | Exceptional 21.5% |
| Chippewa | 99.6 /100 | #83 | Exceptional 21.5% |
| Icelanders | 99.6 /100 | #84 | Exceptional 21.5% |
| Laotians | 99.6 /100 | #85 | Exceptional 21.5% |
| Delaware | 99.6 /100 | #86 | Exceptional 21.5% |
| Immigrants | Azores | 99.5 /100 | #87 | Exceptional 21.5% |