Immigrants from Afghanistan vs Guatemalan Married-Couple Family Poverty
COMPARE
Immigrants from Afghanistan
Guatemalan
Married-Couple Family Poverty
Married-Couple Family Poverty Comparison
Immigrants from Afghanistan
Guatemalans
5.8%
MARRIED-COUPLE FAMILY POVERTY
2.1/ 100
METRIC RATING
245th/ 347
METRIC RANK
7.0%
MARRIED-COUPLE FAMILY POVERTY
0.0/ 100
METRIC RATING
307th/ 347
METRIC RANK
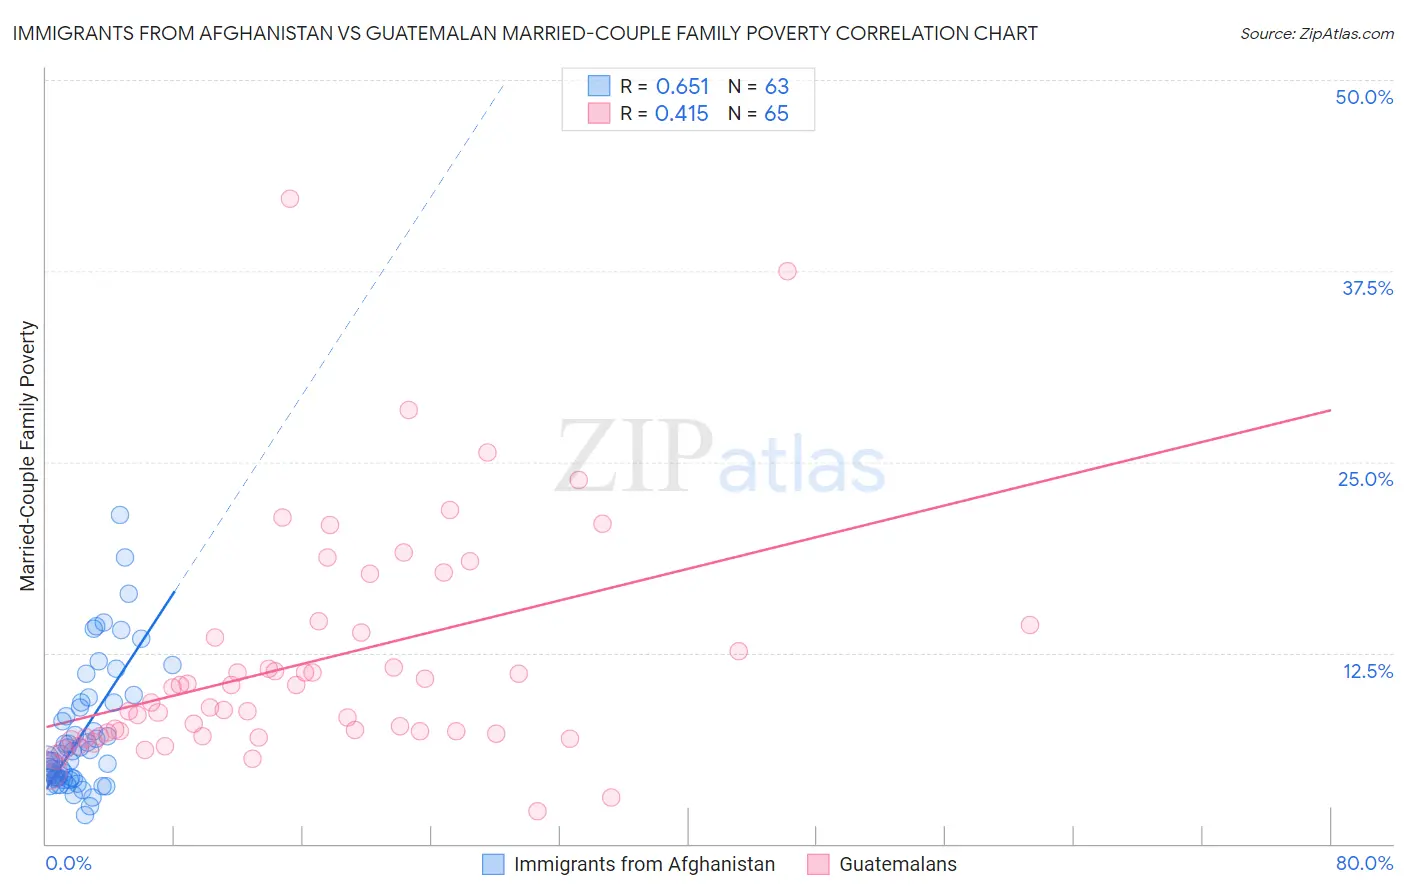
Immigrants from Afghanistan vs Guatemalan Married-Couple Family Poverty Correlation Chart
The statistical analysis conducted on geographies consisting of 147,133,206 people shows a significant positive correlation between the proportion of Immigrants from Afghanistan and poverty level among married-couple families in the United States with a correlation coefficient (R) of 0.651 and weighted average of 5.8%. Similarly, the statistical analysis conducted on geographies consisting of 406,520,979 people shows a moderate positive correlation between the proportion of Guatemalans and poverty level among married-couple families in the United States with a correlation coefficient (R) of 0.415 and weighted average of 7.0%, a difference of 21.4%.
Married-Couple Family Poverty Correlation Summary
| Measurement | Immigrants from Afghanistan | Guatemalan |
| Minimum | 1.9% | 2.1% |
| Maximum | 21.6% | 42.2% |
| Range | 19.6% | 40.1% |
| Mean | 7.2% | 11.9% |
| Median | 5.6% | 9.3% |
| Interquartile 25% (IQ1) | 4.3% | 7.1% |
| Interquartile 75% (IQ3) | 9.2% | 14.1% |
| Interquartile Range (IQR) | 4.9% | 7.0% |
| Standard Deviation (Sample) | 4.1% | 7.5% |
| Standard Deviation (Population) | 4.1% | 7.5% |
Similar Demographics by Married-Couple Family Poverty
Demographics Similar to Immigrants from Afghanistan by Married-Couple Family Poverty
In terms of married-couple family poverty, the demographic groups most similar to Immigrants from Afghanistan are Chickasaw (5.8%, a difference of 0.15%), Somali (5.8%, a difference of 0.16%), Immigrants from Western Africa (5.8%, a difference of 0.31%), Immigrants from Panama (5.8%, a difference of 0.40%), and Fijian (5.8%, a difference of 0.43%).
| Demographics | Rating | Rank | Married-Couple Family Poverty |
| Cherokee | 2.7 /100 | #238 | Tragic 5.8% |
| Venezuelans | 2.7 /100 | #239 | Tragic 5.8% |
| Fijians | 2.5 /100 | #240 | Tragic 5.8% |
| Immigrants | Panama | 2.5 /100 | #241 | Tragic 5.8% |
| Immigrants | Western Africa | 2.4 /100 | #242 | Tragic 5.8% |
| Somalis | 2.3 /100 | #243 | Tragic 5.8% |
| Chickasaw | 2.3 /100 | #244 | Tragic 5.8% |
| Immigrants | Afghanistan | 2.1 /100 | #245 | Tragic 5.8% |
| Immigrants | Venezuela | 1.8 /100 | #246 | Tragic 5.8% |
| Iraqis | 1.4 /100 | #247 | Tragic 5.9% |
| Cree | 1.2 /100 | #248 | Tragic 5.9% |
| Tsimshian | 1.1 /100 | #249 | Tragic 5.9% |
| Immigrants | Eritrea | 1.1 /100 | #250 | Tragic 5.9% |
| Immigrants | Ghana | 1.0 /100 | #251 | Tragic 5.9% |
| Immigrants | Western Asia | 0.7 /100 | #252 | Tragic 6.0% |
Demographics Similar to Guatemalans by Married-Couple Family Poverty
In terms of married-couple family poverty, the demographic groups most similar to Guatemalans are Spanish American Indian (7.1%, a difference of 0.18%), Hopi (7.1%, a difference of 0.78%), Immigrants from Nicaragua (7.1%, a difference of 0.81%), Immigrants from Dominica (7.1%, a difference of 0.86%), and Immigrants from Armenia (7.1%, a difference of 0.86%).
| Demographics | Rating | Rank | Married-Couple Family Poverty |
| Immigrants | Belize | 0.0 /100 | #300 | Tragic 6.7% |
| Central Americans | 0.0 /100 | #301 | Tragic 6.7% |
| Immigrants | Ecuador | 0.0 /100 | #302 | Tragic 6.7% |
| Immigrants | El Salvador | 0.0 /100 | #303 | Tragic 6.8% |
| Cubans | 0.0 /100 | #304 | Tragic 6.8% |
| Haitians | 0.0 /100 | #305 | Tragic 6.8% |
| Immigrants | Haiti | 0.0 /100 | #306 | Tragic 7.0% |
| Guatemalans | 0.0 /100 | #307 | Tragic 7.0% |
| Spanish American Indians | 0.0 /100 | #308 | Tragic 7.1% |
| Hopi | 0.0 /100 | #309 | Tragic 7.1% |
| Immigrants | Nicaragua | 0.0 /100 | #310 | Tragic 7.1% |
| Immigrants | Dominica | 0.0 /100 | #311 | Tragic 7.1% |
| Immigrants | Armenia | 0.0 /100 | #312 | Tragic 7.1% |
| Immigrants | St. Vincent and the Grenadines | 0.0 /100 | #313 | Tragic 7.1% |
| British West Indians | 0.0 /100 | #314 | Tragic 7.1% |