Spaniard vs Guatemalan Married-Couple Family Poverty
COMPARE
Spaniard
Guatemalan
Married-Couple Family Poverty
Married-Couple Family Poverty Comparison
Spaniards
Guatemalans
5.4%
MARRIED-COUPLE FAMILY POVERTY
27.4/ 100
METRIC RATING
196th/ 347
METRIC RANK
7.0%
MARRIED-COUPLE FAMILY POVERTY
0.0/ 100
METRIC RATING
307th/ 347
METRIC RANK
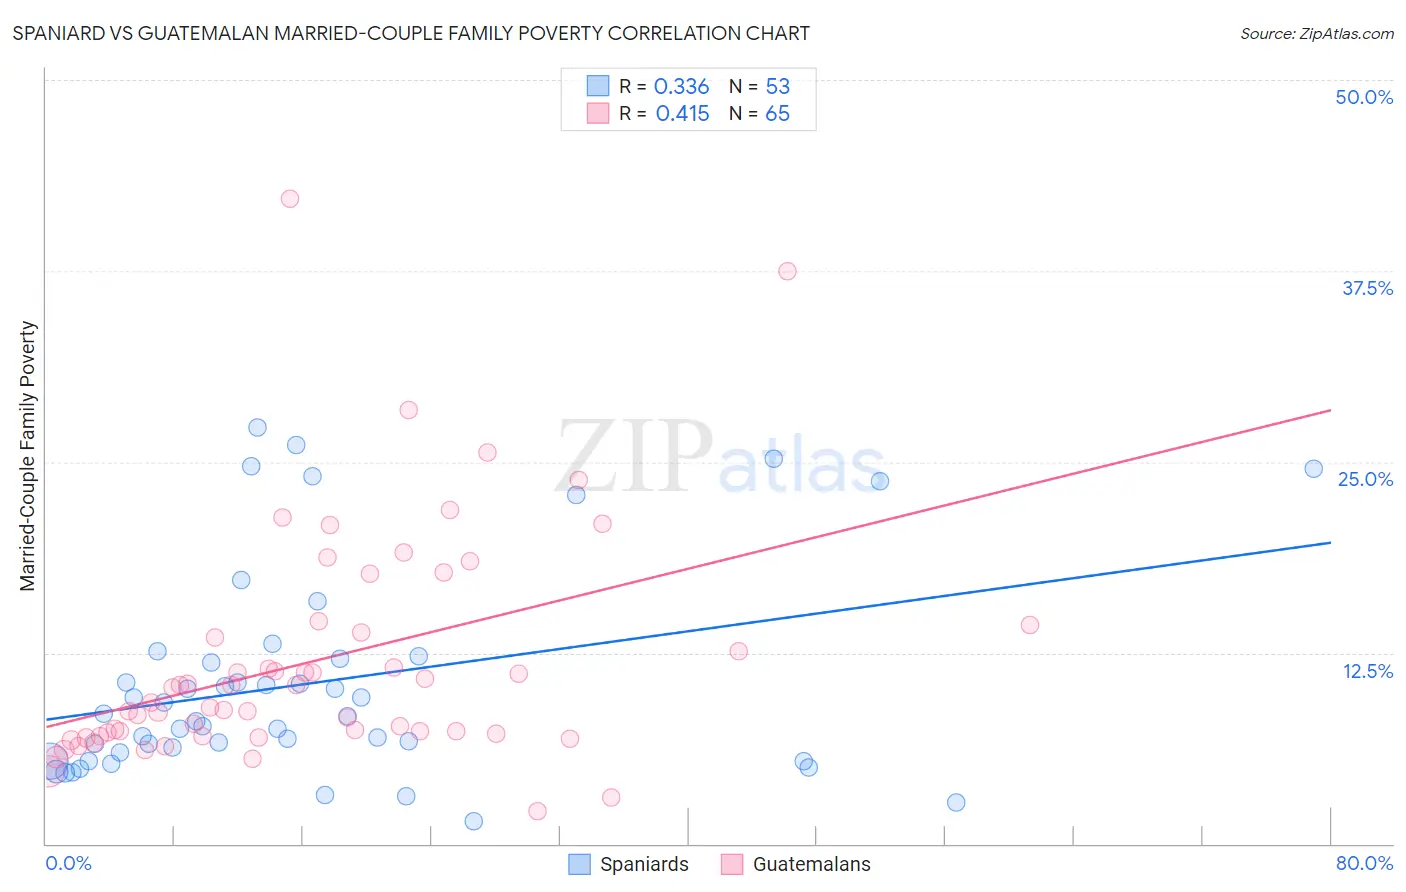
Spaniard vs Guatemalan Married-Couple Family Poverty Correlation Chart
The statistical analysis conducted on geographies consisting of 439,020,295 people shows a mild positive correlation between the proportion of Spaniards and poverty level among married-couple families in the United States with a correlation coefficient (R) of 0.336 and weighted average of 5.4%. Similarly, the statistical analysis conducted on geographies consisting of 406,520,979 people shows a moderate positive correlation between the proportion of Guatemalans and poverty level among married-couple families in the United States with a correlation coefficient (R) of 0.415 and weighted average of 7.0%, a difference of 31.1%.
Married-Couple Family Poverty Correlation Summary
| Measurement | Spaniard | Guatemalan |
| Minimum | 1.5% | 2.1% |
| Maximum | 27.3% | 42.2% |
| Range | 25.8% | 40.1% |
| Mean | 10.5% | 11.9% |
| Median | 8.3% | 9.3% |
| Interquartile 25% (IQ1) | 5.7% | 7.1% |
| Interquartile 75% (IQ3) | 12.2% | 14.1% |
| Interquartile Range (IQR) | 6.5% | 7.0% |
| Standard Deviation (Sample) | 6.9% | 7.5% |
| Standard Deviation (Population) | 6.8% | 7.5% |
Similar Demographics by Married-Couple Family Poverty
Demographics Similar to Spaniards by Married-Couple Family Poverty
In terms of married-couple family poverty, the demographic groups most similar to Spaniards are Immigrants from the Azores (5.4%, a difference of 0.020%), Immigrants from Israel (5.4%, a difference of 0.060%), Liberian (5.4%, a difference of 0.15%), Immigrants from Belarus (5.4%, a difference of 0.18%), and Malaysian (5.4%, a difference of 0.29%).
| Demographics | Rating | Rank | Married-Couple Family Poverty |
| South American Indians | 32.5 /100 | #189 | Fair 5.3% |
| Ugandans | 31.6 /100 | #190 | Fair 5.3% |
| Immigrants | Cabo Verde | 30.9 /100 | #191 | Fair 5.3% |
| Cape Verdeans | 30.7 /100 | #192 | Fair 5.3% |
| Malaysians | 29.5 /100 | #193 | Fair 5.4% |
| Immigrants | Israel | 27.8 /100 | #194 | Fair 5.4% |
| Immigrants | Azores | 27.5 /100 | #195 | Fair 5.4% |
| Spaniards | 27.4 /100 | #196 | Fair 5.4% |
| Liberians | 26.3 /100 | #197 | Fair 5.4% |
| Immigrants | Belarus | 26.2 /100 | #198 | Fair 5.4% |
| Uruguayans | 25.0 /100 | #199 | Fair 5.4% |
| Immigrants | Morocco | 24.3 /100 | #200 | Fair 5.4% |
| Lebanese | 24.1 /100 | #201 | Fair 5.4% |
| Immigrants | Middle Africa | 23.8 /100 | #202 | Fair 5.4% |
| Immigrants | Peru | 21.8 /100 | #203 | Fair 5.4% |
Demographics Similar to Guatemalans by Married-Couple Family Poverty
In terms of married-couple family poverty, the demographic groups most similar to Guatemalans are Spanish American Indian (7.1%, a difference of 0.18%), Hopi (7.1%, a difference of 0.78%), Immigrants from Nicaragua (7.1%, a difference of 0.81%), Immigrants from Dominica (7.1%, a difference of 0.86%), and Immigrants from Armenia (7.1%, a difference of 0.86%).
| Demographics | Rating | Rank | Married-Couple Family Poverty |
| Immigrants | Belize | 0.0 /100 | #300 | Tragic 6.7% |
| Central Americans | 0.0 /100 | #301 | Tragic 6.7% |
| Immigrants | Ecuador | 0.0 /100 | #302 | Tragic 6.7% |
| Immigrants | El Salvador | 0.0 /100 | #303 | Tragic 6.8% |
| Cubans | 0.0 /100 | #304 | Tragic 6.8% |
| Haitians | 0.0 /100 | #305 | Tragic 6.8% |
| Immigrants | Haiti | 0.0 /100 | #306 | Tragic 7.0% |
| Guatemalans | 0.0 /100 | #307 | Tragic 7.0% |
| Spanish American Indians | 0.0 /100 | #308 | Tragic 7.1% |
| Hopi | 0.0 /100 | #309 | Tragic 7.1% |
| Immigrants | Nicaragua | 0.0 /100 | #310 | Tragic 7.1% |
| Immigrants | Dominica | 0.0 /100 | #311 | Tragic 7.1% |
| Immigrants | Armenia | 0.0 /100 | #312 | Tragic 7.1% |
| Immigrants | St. Vincent and the Grenadines | 0.0 /100 | #313 | Tragic 7.1% |
| British West Indians | 0.0 /100 | #314 | Tragic 7.1% |