Iraqi vs Australian Married-Couple Family Poverty
COMPARE
Iraqi
Australian
Married-Couple Family Poverty
Married-Couple Family Poverty Comparison
Iraqis
Australians
5.9%
MARRIED-COUPLE FAMILY POVERTY
1.4/ 100
METRIC RATING
247th/ 347
METRIC RANK
4.3%
MARRIED-COUPLE FAMILY POVERTY
99.7/ 100
METRIC RATING
48th/ 347
METRIC RANK
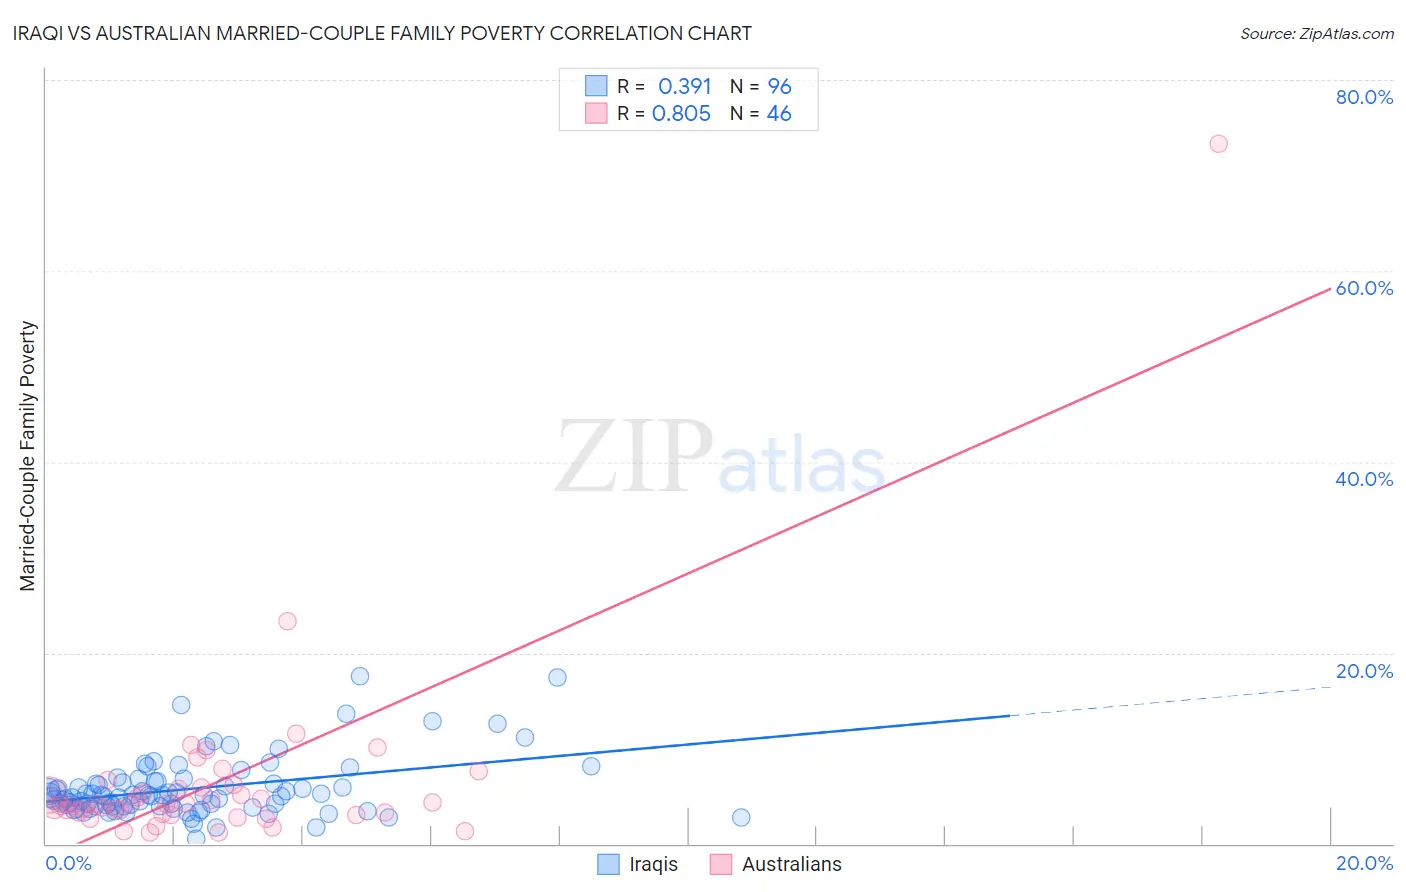
Iraqi vs Australian Married-Couple Family Poverty Correlation Chart
The statistical analysis conducted on geographies consisting of 170,086,919 people shows a mild positive correlation between the proportion of Iraqis and poverty level among married-couple families in the United States with a correlation coefficient (R) of 0.391 and weighted average of 5.9%. Similarly, the statistical analysis conducted on geographies consisting of 222,779,850 people shows a very strong positive correlation between the proportion of Australians and poverty level among married-couple families in the United States with a correlation coefficient (R) of 0.805 and weighted average of 4.3%, a difference of 36.0%.
Married-Couple Family Poverty Correlation Summary
| Measurement | Iraqi | Australian |
| Minimum | 0.50% | 1.1% |
| Maximum | 17.6% | 73.3% |
| Range | 17.1% | 72.2% |
| Mean | 5.8% | 6.5% |
| Median | 5.0% | 4.1% |
| Interquartile 25% (IQ1) | 3.9% | 3.2% |
| Interquartile 75% (IQ3) | 6.5% | 5.9% |
| Interquartile Range (IQR) | 2.5% | 2.7% |
| Standard Deviation (Sample) | 3.1% | 10.7% |
| Standard Deviation (Population) | 3.1% | 10.6% |
Similar Demographics by Married-Couple Family Poverty
Demographics Similar to Iraqis by Married-Couple Family Poverty
In terms of married-couple family poverty, the demographic groups most similar to Iraqis are Cree (5.9%, a difference of 0.42%), Tsimshian (5.9%, a difference of 0.52%), Immigrants from Venezuela (5.8%, a difference of 0.62%), Immigrants from Eritrea (5.9%, a difference of 0.74%), and Immigrants from Ghana (5.9%, a difference of 0.99%).
| Demographics | Rating | Rank | Married-Couple Family Poverty |
| Fijians | 2.5 /100 | #240 | Tragic 5.8% |
| Immigrants | Panama | 2.5 /100 | #241 | Tragic 5.8% |
| Immigrants | Western Africa | 2.4 /100 | #242 | Tragic 5.8% |
| Somalis | 2.3 /100 | #243 | Tragic 5.8% |
| Chickasaw | 2.3 /100 | #244 | Tragic 5.8% |
| Immigrants | Afghanistan | 2.1 /100 | #245 | Tragic 5.8% |
| Immigrants | Venezuela | 1.8 /100 | #246 | Tragic 5.8% |
| Iraqis | 1.4 /100 | #247 | Tragic 5.9% |
| Cree | 1.2 /100 | #248 | Tragic 5.9% |
| Tsimshian | 1.1 /100 | #249 | Tragic 5.9% |
| Immigrants | Eritrea | 1.1 /100 | #250 | Tragic 5.9% |
| Immigrants | Ghana | 1.0 /100 | #251 | Tragic 5.9% |
| Immigrants | Western Asia | 0.7 /100 | #252 | Tragic 6.0% |
| Africans | 0.7 /100 | #253 | Tragic 6.0% |
| Immigrants | Somalia | 0.7 /100 | #254 | Tragic 6.0% |
Demographics Similar to Australians by Married-Couple Family Poverty
In terms of married-couple family poverty, the demographic groups most similar to Australians are Immigrants from South Central Asia (4.3%, a difference of 0.070%), Turkish (4.3%, a difference of 0.080%), Burmese (4.3%, a difference of 0.18%), British (4.3%, a difference of 0.19%), and Immigrants from Lithuania (4.3%, a difference of 0.19%).
| Demographics | Rating | Rank | Married-Couple Family Poverty |
| Northern Europeans | 99.8 /100 | #41 | Exceptional 4.3% |
| Scottish | 99.8 /100 | #42 | Exceptional 4.3% |
| Swiss | 99.8 /100 | #43 | Exceptional 4.3% |
| Immigrants | Japan | 99.8 /100 | #44 | Exceptional 4.3% |
| Serbians | 99.8 /100 | #45 | Exceptional 4.3% |
| British | 99.8 /100 | #46 | Exceptional 4.3% |
| Immigrants | South Central Asia | 99.8 /100 | #47 | Exceptional 4.3% |
| Australians | 99.7 /100 | #48 | Exceptional 4.3% |
| Turks | 99.7 /100 | #49 | Exceptional 4.3% |
| Burmese | 99.7 /100 | #50 | Exceptional 4.3% |
| Immigrants | Lithuania | 99.7 /100 | #51 | Exceptional 4.3% |
| Russians | 99.7 /100 | #52 | Exceptional 4.3% |
| Welsh | 99.7 /100 | #53 | Exceptional 4.3% |
| Austrians | 99.7 /100 | #54 | Exceptional 4.3% |
| French | 99.7 /100 | #55 | Exceptional 4.3% |