Iraqi vs Cajun Married-Couple Family Poverty
COMPARE
Iraqi
Cajun
Married-Couple Family Poverty
Married-Couple Family Poverty Comparison
Iraqis
Cajuns
5.9%
MARRIED-COUPLE FAMILY POVERTY
1.4/ 100
METRIC RATING
247th/ 347
METRIC RANK
5.6%
MARRIED-COUPLE FAMILY POVERTY
6.9/ 100
METRIC RATING
222nd/ 347
METRIC RANK
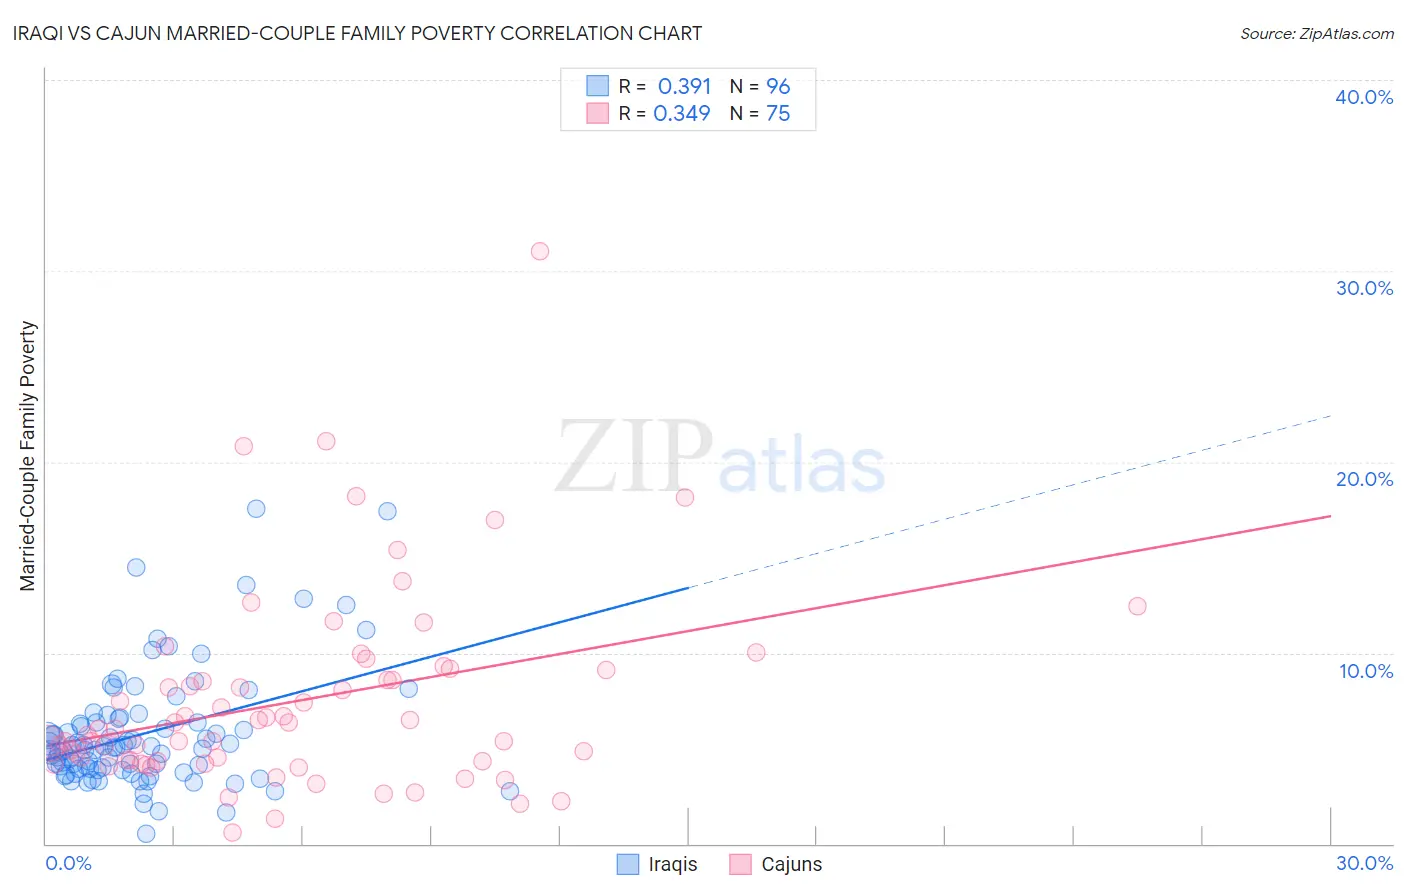
Iraqi vs Cajun Married-Couple Family Poverty Correlation Chart
The statistical analysis conducted on geographies consisting of 170,086,919 people shows a mild positive correlation between the proportion of Iraqis and poverty level among married-couple families in the United States with a correlation coefficient (R) of 0.391 and weighted average of 5.9%. Similarly, the statistical analysis conducted on geographies consisting of 149,203,084 people shows a mild positive correlation between the proportion of Cajuns and poverty level among married-couple families in the United States with a correlation coefficient (R) of 0.349 and weighted average of 5.6%, a difference of 4.5%.
Married-Couple Family Poverty Correlation Summary
| Measurement | Iraqi | Cajun |
| Minimum | 0.50% | 0.57% |
| Maximum | 17.6% | 31.0% |
| Range | 17.1% | 30.5% |
| Mean | 5.8% | 7.5% |
| Median | 5.0% | 6.0% |
| Interquartile 25% (IQ1) | 3.9% | 4.3% |
| Interquartile 75% (IQ3) | 6.5% | 9.1% |
| Interquartile Range (IQR) | 2.5% | 4.8% |
| Standard Deviation (Sample) | 3.1% | 5.1% |
| Standard Deviation (Population) | 3.1% | 5.1% |
Similar Demographics by Married-Couple Family Poverty
Demographics Similar to Iraqis by Married-Couple Family Poverty
In terms of married-couple family poverty, the demographic groups most similar to Iraqis are Cree (5.9%, a difference of 0.42%), Tsimshian (5.9%, a difference of 0.52%), Immigrants from Venezuela (5.8%, a difference of 0.62%), Immigrants from Eritrea (5.9%, a difference of 0.74%), and Immigrants from Ghana (5.9%, a difference of 0.99%).
| Demographics | Rating | Rank | Married-Couple Family Poverty |
| Fijians | 2.5 /100 | #240 | Tragic 5.8% |
| Immigrants | Panama | 2.5 /100 | #241 | Tragic 5.8% |
| Immigrants | Western Africa | 2.4 /100 | #242 | Tragic 5.8% |
| Somalis | 2.3 /100 | #243 | Tragic 5.8% |
| Chickasaw | 2.3 /100 | #244 | Tragic 5.8% |
| Immigrants | Afghanistan | 2.1 /100 | #245 | Tragic 5.8% |
| Immigrants | Venezuela | 1.8 /100 | #246 | Tragic 5.8% |
| Iraqis | 1.4 /100 | #247 | Tragic 5.9% |
| Cree | 1.2 /100 | #248 | Tragic 5.9% |
| Tsimshian | 1.1 /100 | #249 | Tragic 5.9% |
| Immigrants | Eritrea | 1.1 /100 | #250 | Tragic 5.9% |
| Immigrants | Ghana | 1.0 /100 | #251 | Tragic 5.9% |
| Immigrants | Western Asia | 0.7 /100 | #252 | Tragic 6.0% |
| Africans | 0.7 /100 | #253 | Tragic 6.0% |
| Immigrants | Somalia | 0.7 /100 | #254 | Tragic 6.0% |
Demographics Similar to Cajuns by Married-Couple Family Poverty
In terms of married-couple family poverty, the demographic groups most similar to Cajuns are Immigrants from Fiji (5.6%, a difference of 0.070%), Sudanese (5.6%, a difference of 0.18%), Immigrants from Cambodia (5.6%, a difference of 0.32%), South American (5.6%, a difference of 0.55%), and Immigrants from Zaire (5.6%, a difference of 0.56%).
| Demographics | Rating | Rank | Married-Couple Family Poverty |
| Armenians | 12.8 /100 | #215 | Poor 5.5% |
| Potawatomi | 12.4 /100 | #216 | Poor 5.5% |
| Immigrants | Nigeria | 11.3 /100 | #217 | Poor 5.5% |
| Afghans | 11.2 /100 | #218 | Poor 5.5% |
| Japanese | 9.8 /100 | #219 | Tragic 5.6% |
| Colombians | 9.2 /100 | #220 | Tragic 5.6% |
| Panamanians | 9.2 /100 | #221 | Tragic 5.6% |
| Cajuns | 6.9 /100 | #222 | Tragic 5.6% |
| Immigrants | Fiji | 6.7 /100 | #223 | Tragic 5.6% |
| Sudanese | 6.4 /100 | #224 | Tragic 5.6% |
| Immigrants | Cambodia | 6.1 /100 | #225 | Tragic 5.6% |
| South Americans | 5.7 /100 | #226 | Tragic 5.6% |
| Immigrants | Zaire | 5.6 /100 | #227 | Tragic 5.6% |
| Arabs | 5.4 /100 | #228 | Tragic 5.7% |
| Sub-Saharan Africans | 4.9 /100 | #229 | Tragic 5.7% |