Immigrants from West Indies vs Immigrants from Denmark Married-Couple Family Poverty
COMPARE
Immigrants from West Indies
Immigrants from Denmark
Married-Couple Family Poverty
Married-Couple Family Poverty Comparison
Immigrants from West Indies
Immigrants from Denmark
6.2%
MARRIED-COUPLE FAMILY POVERTY
0.1/ 100
METRIC RATING
269th/ 347
METRIC RANK
4.6%
MARRIED-COUPLE FAMILY POVERTY
98.8/ 100
METRIC RATING
83rd/ 347
METRIC RANK
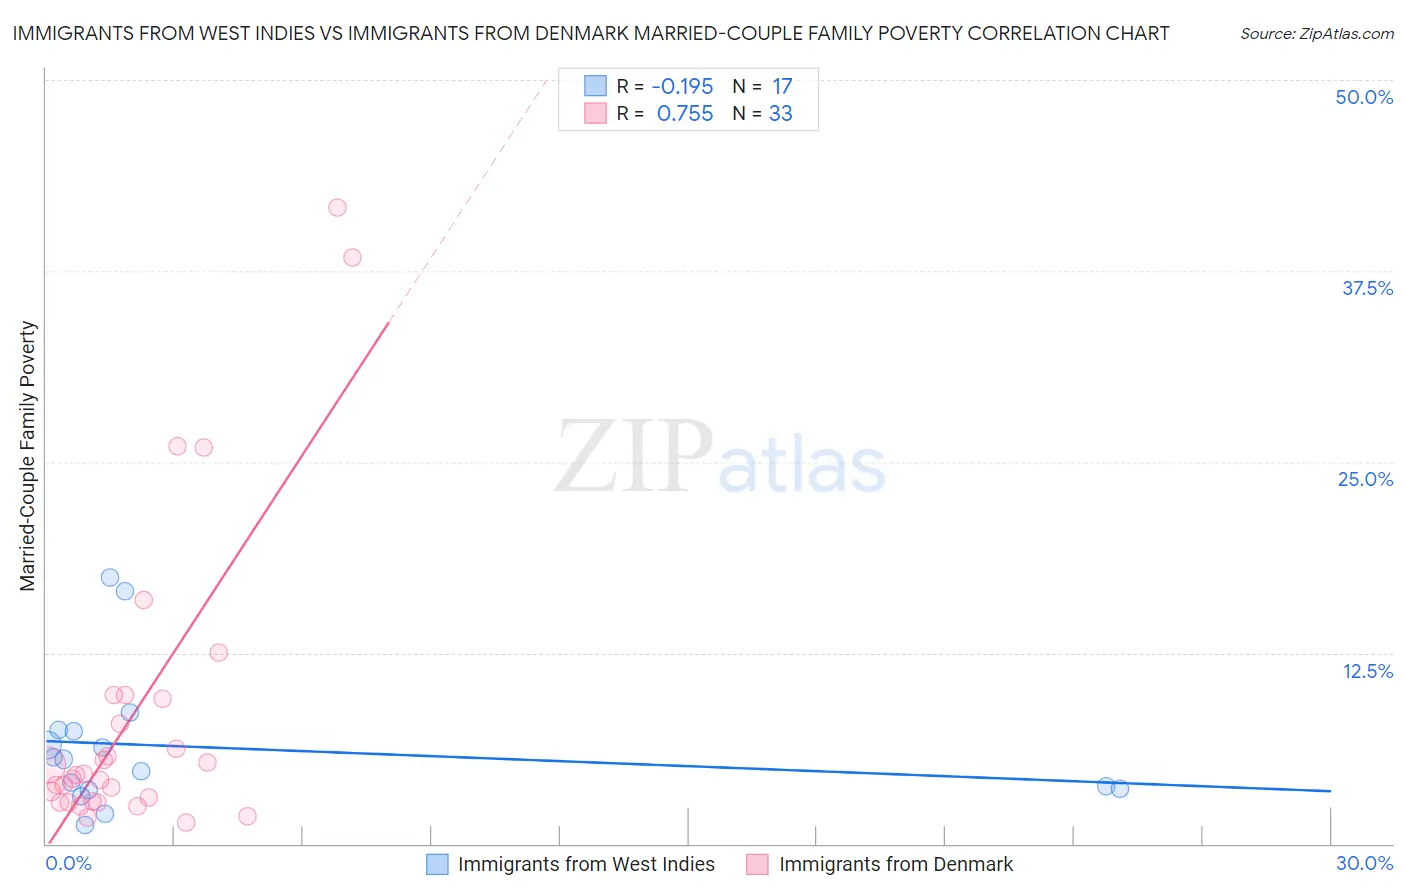
Immigrants from West Indies vs Immigrants from Denmark Married-Couple Family Poverty Correlation Chart
The statistical analysis conducted on geographies consisting of 72,419,228 people shows a poor negative correlation between the proportion of Immigrants from West Indies and poverty level among married-couple families in the United States with a correlation coefficient (R) of -0.195 and weighted average of 6.2%. Similarly, the statistical analysis conducted on geographies consisting of 135,843,951 people shows a strong positive correlation between the proportion of Immigrants from Denmark and poverty level among married-couple families in the United States with a correlation coefficient (R) of 0.755 and weighted average of 4.6%, a difference of 36.5%.
Married-Couple Family Poverty Correlation Summary
| Measurement | Immigrants from West Indies | Immigrants from Denmark |
| Minimum | 1.2% | 1.4% |
| Maximum | 17.4% | 41.7% |
| Range | 16.2% | 40.3% |
| Mean | 6.3% | 8.5% |
| Median | 5.5% | 4.5% |
| Interquartile 25% (IQ1) | 3.6% | 2.8% |
| Interquartile 75% (IQ3) | 7.4% | 9.6% |
| Interquartile Range (IQR) | 3.8% | 6.8% |
| Standard Deviation (Sample) | 4.5% | 10.1% |
| Standard Deviation (Population) | 4.3% | 9.9% |
Similar Demographics by Married-Couple Family Poverty
Demographics Similar to Immigrants from West Indies by Married-Couple Family Poverty
In terms of married-couple family poverty, the demographic groups most similar to Immigrants from West Indies are Immigrants from Jamaica (6.2%, a difference of 0.040%), Alaska Native (6.2%, a difference of 0.17%), Immigrants from Bahamas (6.2%, a difference of 0.26%), Trinidadian and Tobagonian (6.2%, a difference of 0.29%), and Spanish American (6.2%, a difference of 0.65%).
| Demographics | Rating | Rank | Married-Couple Family Poverty |
| Shoshone | 0.3 /100 | #262 | Tragic 6.1% |
| Immigrants | Senegal | 0.3 /100 | #263 | Tragic 6.1% |
| Immigrants | Congo | 0.2 /100 | #264 | Tragic 6.1% |
| Blackfeet | 0.2 /100 | #265 | Tragic 6.2% |
| Creek | 0.2 /100 | #266 | Tragic 6.2% |
| Spanish Americans | 0.2 /100 | #267 | Tragic 6.2% |
| Alaska Natives | 0.2 /100 | #268 | Tragic 6.2% |
| Immigrants | West Indies | 0.1 /100 | #269 | Tragic 6.2% |
| Immigrants | Jamaica | 0.1 /100 | #270 | Tragic 6.2% |
| Immigrants | Bahamas | 0.1 /100 | #271 | Tragic 6.2% |
| Trinidadians and Tobagonians | 0.1 /100 | #272 | Tragic 6.2% |
| Colville | 0.1 /100 | #273 | Tragic 6.3% |
| Barbadians | 0.1 /100 | #274 | Tragic 6.3% |
| Choctaw | 0.1 /100 | #275 | Tragic 6.3% |
| Yaqui | 0.1 /100 | #276 | Tragic 6.3% |
Demographics Similar to Immigrants from Denmark by Married-Couple Family Poverty
In terms of married-couple family poverty, the demographic groups most similar to Immigrants from Denmark are Immigrants from Croatia (4.6%, a difference of 0.13%), Canadian (4.5%, a difference of 0.16%), South African (4.6%, a difference of 0.36%), Immigrants from Turkey (4.6%, a difference of 0.40%), and Immigrants from Greece (4.5%, a difference of 0.41%).
| Demographics | Rating | Rank | Married-Couple Family Poverty |
| Immigrants | South Africa | 99.1 /100 | #76 | Exceptional 4.5% |
| Immigrants | Latvia | 99.1 /100 | #77 | Exceptional 4.5% |
| Scotch-Irish | 99.1 /100 | #78 | Exceptional 4.5% |
| Immigrants | Iran | 99.0 /100 | #79 | Exceptional 4.5% |
| Icelanders | 99.0 /100 | #80 | Exceptional 4.5% |
| Immigrants | Greece | 98.9 /100 | #81 | Exceptional 4.5% |
| Canadians | 98.8 /100 | #82 | Exceptional 4.5% |
| Immigrants | Denmark | 98.8 /100 | #83 | Exceptional 4.6% |
| Immigrants | Croatia | 98.7 /100 | #84 | Exceptional 4.6% |
| South Africans | 98.7 /100 | #85 | Exceptional 4.6% |
| Immigrants | Turkey | 98.6 /100 | #86 | Exceptional 4.6% |
| Immigrants | North Macedonia | 98.6 /100 | #87 | Exceptional 4.6% |
| Bolivians | 98.6 /100 | #88 | Exceptional 4.6% |
| Immigrants | Czechoslovakia | 98.5 /100 | #89 | Exceptional 4.6% |
| Immigrants | Switzerland | 98.5 /100 | #90 | Exceptional 4.6% |