Immigrants from West Indies vs Immigrants from Denmark Professional Degree
COMPARE
Immigrants from West Indies
Immigrants from Denmark
Professional Degree
Professional Degree Comparison
Immigrants from West Indies
Immigrants from Denmark
4.0%
PROFESSIONAL DEGREE
5.6/ 100
METRIC RATING
228th/ 347
METRIC RANK
6.4%
PROFESSIONAL DEGREE
100.0/ 100
METRIC RATING
20th/ 347
METRIC RANK
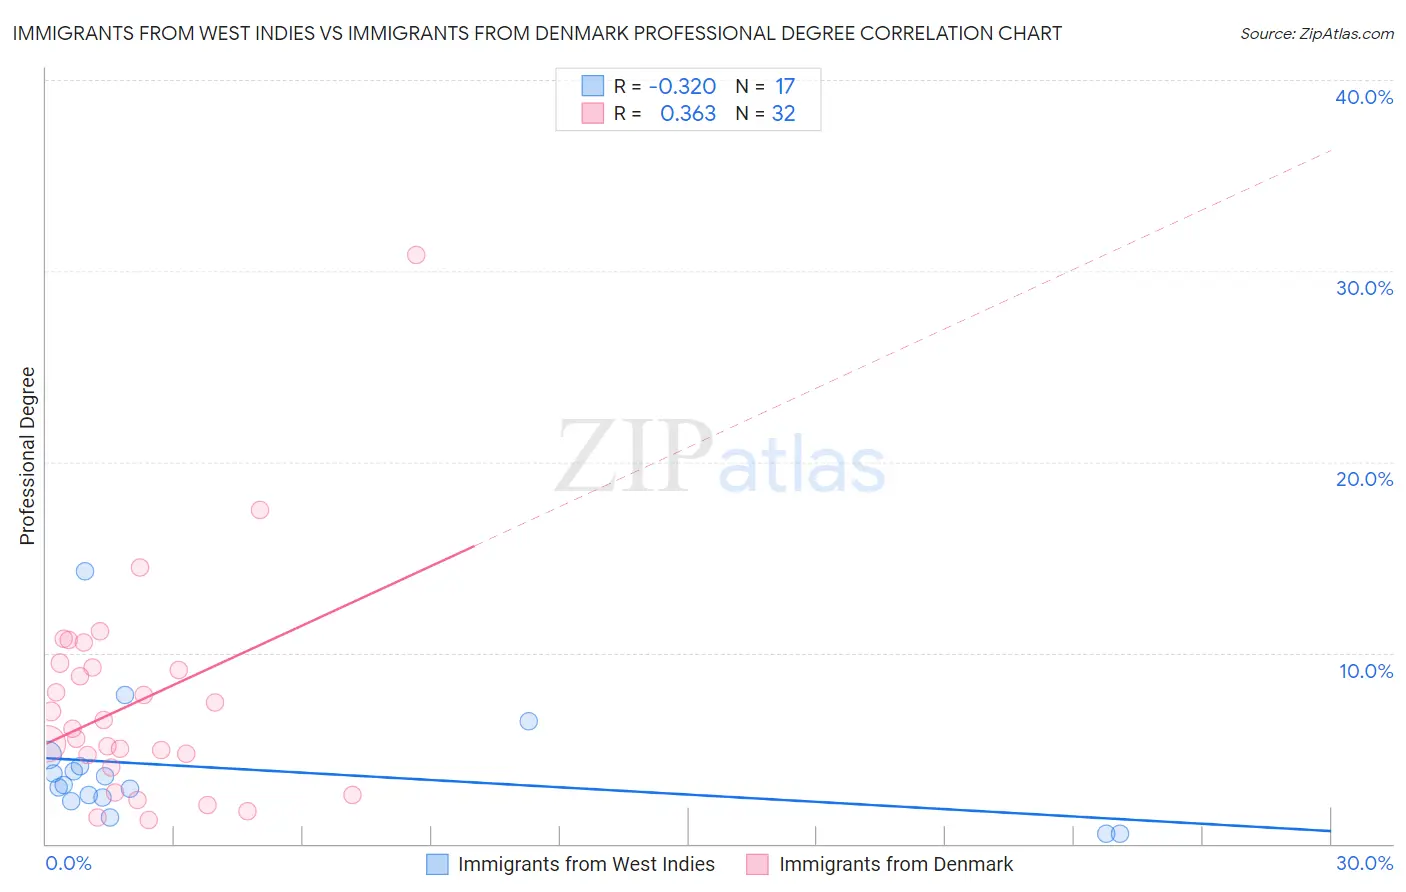
Immigrants from West Indies vs Immigrants from Denmark Professional Degree Correlation Chart
The statistical analysis conducted on geographies consisting of 72,432,787 people shows a mild negative correlation between the proportion of Immigrants from West Indies and percentage of population with at least professional degree education in the United States with a correlation coefficient (R) of -0.320 and weighted average of 4.0%. Similarly, the statistical analysis conducted on geographies consisting of 136,370,124 people shows a mild positive correlation between the proportion of Immigrants from Denmark and percentage of population with at least professional degree education in the United States with a correlation coefficient (R) of 0.363 and weighted average of 6.4%, a difference of 62.5%.
Professional Degree Correlation Summary
| Measurement | Immigrants from West Indies | Immigrants from Denmark |
| Minimum | 0.54% | 1.2% |
| Maximum | 14.3% | 30.8% |
| Range | 13.7% | 29.6% |
| Mean | 3.9% | 7.4% |
| Median | 3.1% | 6.3% |
| Interquartile 25% (IQ1) | 2.3% | 4.3% |
| Interquartile 75% (IQ3) | 4.3% | 9.3% |
| Interquartile Range (IQR) | 2.0% | 5.0% |
| Standard Deviation (Sample) | 3.2% | 5.7% |
| Standard Deviation (Population) | 3.1% | 5.7% |
Similar Demographics by Professional Degree
Demographics Similar to Immigrants from West Indies by Professional Degree
In terms of professional degree, the demographic groups most similar to Immigrants from West Indies are Immigrants from Burma/Myanmar (3.9%, a difference of 0.14%), Cuban (4.0%, a difference of 0.25%), German Russian (4.0%, a difference of 0.37%), Nicaraguan (3.9%, a difference of 0.42%), and Ecuadorian (3.9%, a difference of 0.87%).
| Demographics | Rating | Rank | Professional Degree |
| French Canadians | 8.0 /100 | #221 | Tragic 4.0% |
| Immigrants | Western Africa | 7.5 /100 | #222 | Tragic 4.0% |
| Immigrants | Bosnia and Herzegovina | 7.4 /100 | #223 | Tragic 4.0% |
| Trinidadians and Tobagonians | 7.1 /100 | #224 | Tragic 4.0% |
| Tlingit-Haida | 6.9 /100 | #225 | Tragic 4.0% |
| German Russians | 6.1 /100 | #226 | Tragic 4.0% |
| Cubans | 5.9 /100 | #227 | Tragic 4.0% |
| Immigrants | West Indies | 5.6 /100 | #228 | Tragic 4.0% |
| Immigrants | Burma/Myanmar | 5.4 /100 | #229 | Tragic 3.9% |
| Nicaraguans | 5.1 /100 | #230 | Tragic 3.9% |
| Ecuadorians | 4.6 /100 | #231 | Tragic 3.9% |
| Cree | 4.3 /100 | #232 | Tragic 3.9% |
| Immigrants | Philippines | 4.1 /100 | #233 | Tragic 3.9% |
| Immigrants | Nonimmigrants | 4.0 /100 | #234 | Tragic 3.9% |
| Immigrants | Barbados | 4.0 /100 | #235 | Tragic 3.9% |
Demographics Similar to Immigrants from Denmark by Professional Degree
In terms of professional degree, the demographic groups most similar to Immigrants from Denmark are Immigrants from Hong Kong (6.4%, a difference of 0.22%), Immigrants from Japan (6.4%, a difference of 0.95%), Russian (6.3%, a difference of 1.4%), Immigrants from Spain (6.3%, a difference of 1.5%), and Indian (Asian) (6.5%, a difference of 1.5%).
| Demographics | Rating | Rank | Professional Degree |
| Immigrants | Australia | 100.0 /100 | #13 | Exceptional 6.9% |
| Immigrants | France | 100.0 /100 | #14 | Exceptional 6.8% |
| Immigrants | China | 100.0 /100 | #15 | Exceptional 6.7% |
| Immigrants | Sweden | 100.0 /100 | #16 | Exceptional 6.7% |
| Immigrants | Eastern Asia | 100.0 /100 | #17 | Exceptional 6.6% |
| Soviet Union | 100.0 /100 | #18 | Exceptional 6.6% |
| Indians (Asian) | 100.0 /100 | #19 | Exceptional 6.5% |
| Immigrants | Denmark | 100.0 /100 | #20 | Exceptional 6.4% |
| Immigrants | Hong Kong | 100.0 /100 | #21 | Exceptional 6.4% |
| Immigrants | Japan | 100.0 /100 | #22 | Exceptional 6.4% |
| Russians | 100.0 /100 | #23 | Exceptional 6.3% |
| Immigrants | Spain | 100.0 /100 | #24 | Exceptional 6.3% |
| Immigrants | Ireland | 100.0 /100 | #25 | Exceptional 6.3% |
| Latvians | 100.0 /100 | #26 | Exceptional 6.2% |
| Immigrants | Northern Europe | 100.0 /100 | #27 | Exceptional 6.2% |