Immigrants from West Indies vs Immigrants from Belarus Married-Couple Family Poverty
COMPARE
Immigrants from West Indies
Immigrants from Belarus
Married-Couple Family Poverty
Married-Couple Family Poverty Comparison
Immigrants from West Indies
Immigrants from Belarus
6.2%
MARRIED-COUPLE FAMILY POVERTY
0.1/ 100
METRIC RATING
269th/ 347
METRIC RANK
5.4%
MARRIED-COUPLE FAMILY POVERTY
26.2/ 100
METRIC RATING
198th/ 347
METRIC RANK
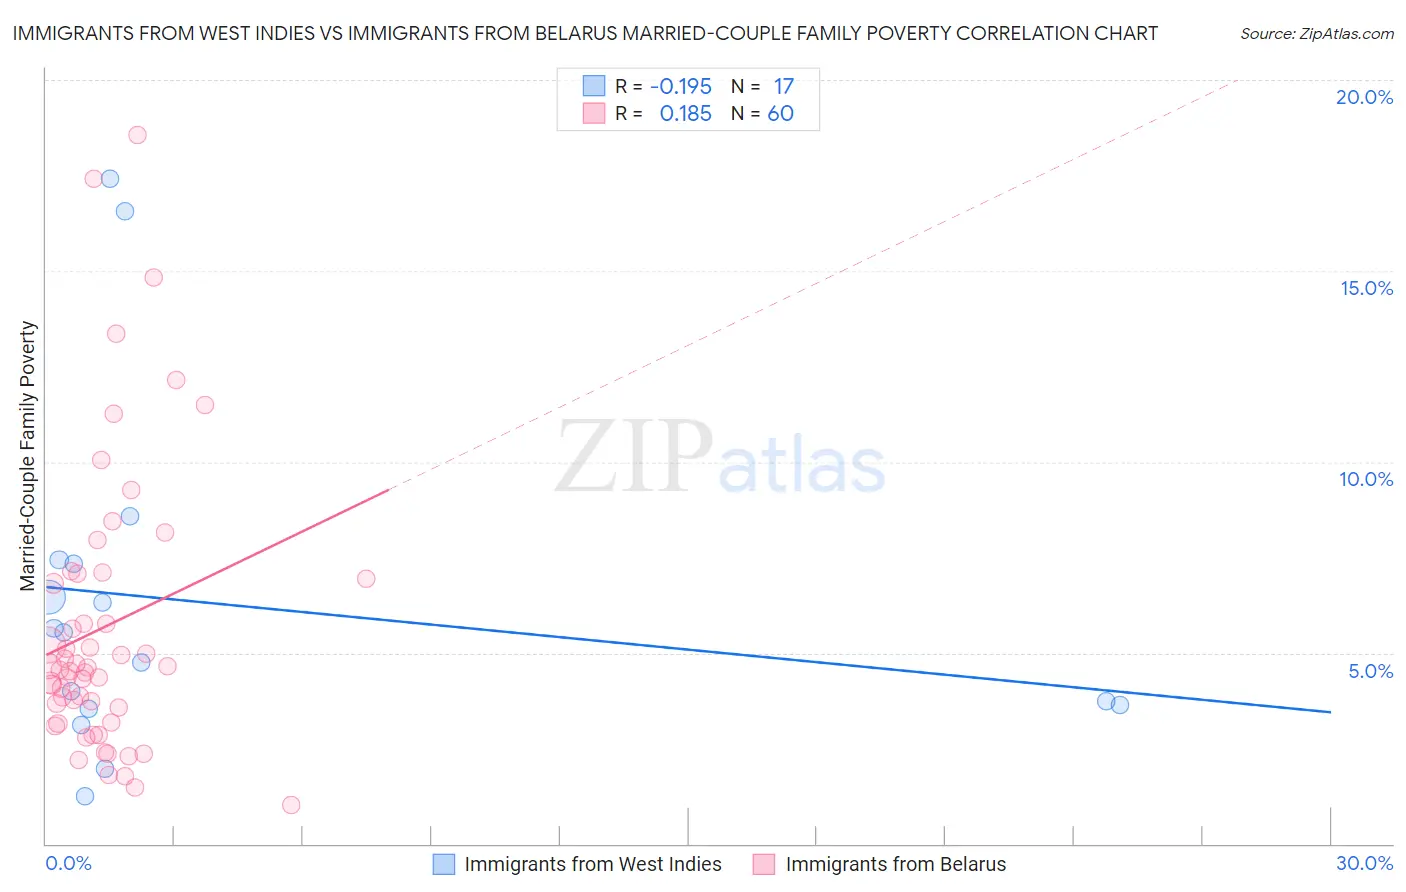
Immigrants from West Indies vs Immigrants from Belarus Married-Couple Family Poverty Correlation Chart
The statistical analysis conducted on geographies consisting of 72,419,228 people shows a poor negative correlation between the proportion of Immigrants from West Indies and poverty level among married-couple families in the United States with a correlation coefficient (R) of -0.195 and weighted average of 6.2%. Similarly, the statistical analysis conducted on geographies consisting of 149,577,130 people shows a poor positive correlation between the proportion of Immigrants from Belarus and poverty level among married-couple families in the United States with a correlation coefficient (R) of 0.185 and weighted average of 5.4%, a difference of 15.6%.
Married-Couple Family Poverty Correlation Summary
| Measurement | Immigrants from West Indies | Immigrants from Belarus |
| Minimum | 1.2% | 1.0% |
| Maximum | 17.4% | 18.5% |
| Range | 16.2% | 17.5% |
| Mean | 6.3% | 5.7% |
| Median | 5.5% | 4.6% |
| Interquartile 25% (IQ1) | 3.6% | 3.4% |
| Interquartile 75% (IQ3) | 7.4% | 7.0% |
| Interquartile Range (IQR) | 3.8% | 3.6% |
| Standard Deviation (Sample) | 4.5% | 3.7% |
| Standard Deviation (Population) | 4.3% | 3.7% |
Similar Demographics by Married-Couple Family Poverty
Demographics Similar to Immigrants from West Indies by Married-Couple Family Poverty
In terms of married-couple family poverty, the demographic groups most similar to Immigrants from West Indies are Immigrants from Jamaica (6.2%, a difference of 0.040%), Alaska Native (6.2%, a difference of 0.17%), Immigrants from Bahamas (6.2%, a difference of 0.26%), Trinidadian and Tobagonian (6.2%, a difference of 0.29%), and Spanish American (6.2%, a difference of 0.65%).
| Demographics | Rating | Rank | Married-Couple Family Poverty |
| Shoshone | 0.3 /100 | #262 | Tragic 6.1% |
| Immigrants | Senegal | 0.3 /100 | #263 | Tragic 6.1% |
| Immigrants | Congo | 0.2 /100 | #264 | Tragic 6.1% |
| Blackfeet | 0.2 /100 | #265 | Tragic 6.2% |
| Creek | 0.2 /100 | #266 | Tragic 6.2% |
| Spanish Americans | 0.2 /100 | #267 | Tragic 6.2% |
| Alaska Natives | 0.2 /100 | #268 | Tragic 6.2% |
| Immigrants | West Indies | 0.1 /100 | #269 | Tragic 6.2% |
| Immigrants | Jamaica | 0.1 /100 | #270 | Tragic 6.2% |
| Immigrants | Bahamas | 0.1 /100 | #271 | Tragic 6.2% |
| Trinidadians and Tobagonians | 0.1 /100 | #272 | Tragic 6.2% |
| Colville | 0.1 /100 | #273 | Tragic 6.3% |
| Barbadians | 0.1 /100 | #274 | Tragic 6.3% |
| Choctaw | 0.1 /100 | #275 | Tragic 6.3% |
| Yaqui | 0.1 /100 | #276 | Tragic 6.3% |
Demographics Similar to Immigrants from Belarus by Married-Couple Family Poverty
In terms of married-couple family poverty, the demographic groups most similar to Immigrants from Belarus are Liberian (5.4%, a difference of 0.020%), Spaniard (5.4%, a difference of 0.18%), Uruguayan (5.4%, a difference of 0.18%), Immigrants from the Azores (5.4%, a difference of 0.20%), and Immigrants from Israel (5.4%, a difference of 0.24%).
| Demographics | Rating | Rank | Married-Couple Family Poverty |
| Immigrants | Cabo Verde | 30.9 /100 | #191 | Fair 5.3% |
| Cape Verdeans | 30.7 /100 | #192 | Fair 5.3% |
| Malaysians | 29.5 /100 | #193 | Fair 5.4% |
| Immigrants | Israel | 27.8 /100 | #194 | Fair 5.4% |
| Immigrants | Azores | 27.5 /100 | #195 | Fair 5.4% |
| Spaniards | 27.4 /100 | #196 | Fair 5.4% |
| Liberians | 26.3 /100 | #197 | Fair 5.4% |
| Immigrants | Belarus | 26.2 /100 | #198 | Fair 5.4% |
| Uruguayans | 25.0 /100 | #199 | Fair 5.4% |
| Immigrants | Morocco | 24.3 /100 | #200 | Fair 5.4% |
| Lebanese | 24.1 /100 | #201 | Fair 5.4% |
| Immigrants | Middle Africa | 23.8 /100 | #202 | Fair 5.4% |
| Immigrants | Peru | 21.8 /100 | #203 | Fair 5.4% |
| Immigrants | Costa Rica | 19.4 /100 | #204 | Poor 5.4% |
| Chippewa | 18.9 /100 | #205 | Poor 5.4% |