Immigrants from West Indies vs Immigrants from Australia Married-Couple Family Poverty
COMPARE
Immigrants from West Indies
Immigrants from Australia
Married-Couple Family Poverty
Married-Couple Family Poverty Comparison
Immigrants from West Indies
Immigrants from Australia
6.2%
MARRIED-COUPLE FAMILY POVERTY
0.1/ 100
METRIC RATING
269th/ 347
METRIC RANK
4.4%
MARRIED-COUPLE FAMILY POVERTY
99.6/ 100
METRIC RATING
62nd/ 347
METRIC RANK
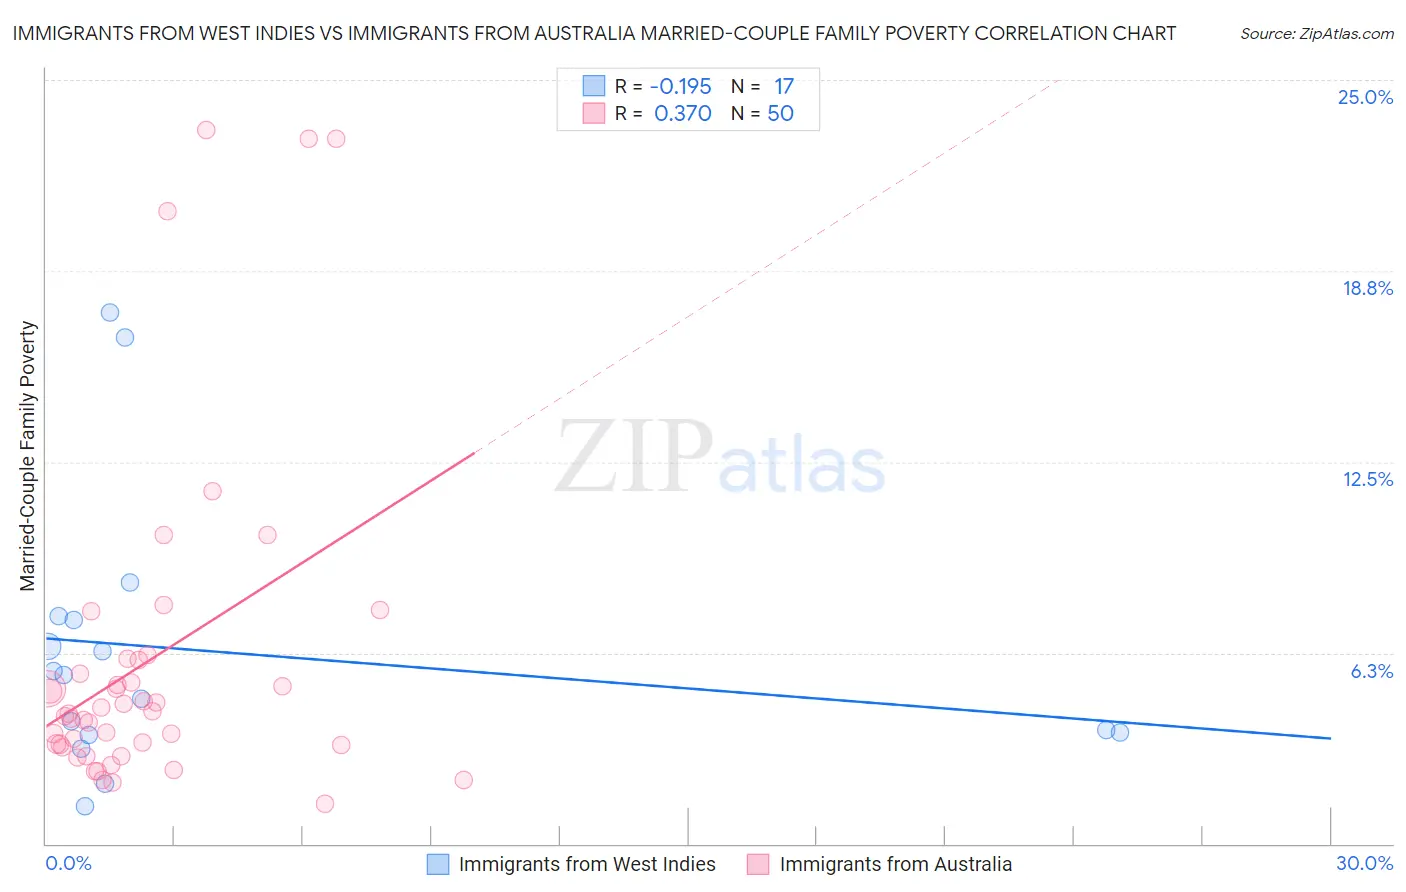
Immigrants from West Indies vs Immigrants from Australia Married-Couple Family Poverty Correlation Chart
The statistical analysis conducted on geographies consisting of 72,419,228 people shows a poor negative correlation between the proportion of Immigrants from West Indies and poverty level among married-couple families in the United States with a correlation coefficient (R) of -0.195 and weighted average of 6.2%. Similarly, the statistical analysis conducted on geographies consisting of 225,813,318 people shows a mild positive correlation between the proportion of Immigrants from Australia and poverty level among married-couple families in the United States with a correlation coefficient (R) of 0.370 and weighted average of 4.4%, a difference of 41.8%.
Married-Couple Family Poverty Correlation Summary
| Measurement | Immigrants from West Indies | Immigrants from Australia |
| Minimum | 1.2% | 1.3% |
| Maximum | 17.4% | 23.4% |
| Range | 16.2% | 22.1% |
| Mean | 6.3% | 6.0% |
| Median | 5.5% | 4.3% |
| Interquartile 25% (IQ1) | 3.6% | 3.2% |
| Interquartile 75% (IQ3) | 7.4% | 6.0% |
| Interquartile Range (IQR) | 3.8% | 2.8% |
| Standard Deviation (Sample) | 4.5% | 5.4% |
| Standard Deviation (Population) | 4.3% | 5.3% |
Similar Demographics by Married-Couple Family Poverty
Demographics Similar to Immigrants from West Indies by Married-Couple Family Poverty
In terms of married-couple family poverty, the demographic groups most similar to Immigrants from West Indies are Immigrants from Jamaica (6.2%, a difference of 0.040%), Alaska Native (6.2%, a difference of 0.17%), Immigrants from Bahamas (6.2%, a difference of 0.26%), Trinidadian and Tobagonian (6.2%, a difference of 0.29%), and Spanish American (6.2%, a difference of 0.65%).
| Demographics | Rating | Rank | Married-Couple Family Poverty |
| Shoshone | 0.3 /100 | #262 | Tragic 6.1% |
| Immigrants | Senegal | 0.3 /100 | #263 | Tragic 6.1% |
| Immigrants | Congo | 0.2 /100 | #264 | Tragic 6.1% |
| Blackfeet | 0.2 /100 | #265 | Tragic 6.2% |
| Creek | 0.2 /100 | #266 | Tragic 6.2% |
| Spanish Americans | 0.2 /100 | #267 | Tragic 6.2% |
| Alaska Natives | 0.2 /100 | #268 | Tragic 6.2% |
| Immigrants | West Indies | 0.1 /100 | #269 | Tragic 6.2% |
| Immigrants | Jamaica | 0.1 /100 | #270 | Tragic 6.2% |
| Immigrants | Bahamas | 0.1 /100 | #271 | Tragic 6.2% |
| Trinidadians and Tobagonians | 0.1 /100 | #272 | Tragic 6.2% |
| Colville | 0.1 /100 | #273 | Tragic 6.3% |
| Barbadians | 0.1 /100 | #274 | Tragic 6.3% |
| Choctaw | 0.1 /100 | #275 | Tragic 6.3% |
| Yaqui | 0.1 /100 | #276 | Tragic 6.3% |
Demographics Similar to Immigrants from Australia by Married-Couple Family Poverty
In terms of married-couple family poverty, the demographic groups most similar to Immigrants from Australia are Okinawan (4.4%, a difference of 0.010%), Tlingit-Haida (4.4%, a difference of 0.12%), Immigrants from Sweden (4.4%, a difference of 0.19%), Immigrants from Sri Lanka (4.4%, a difference of 0.36%), and Czechoslovakian (4.4%, a difference of 0.74%).
| Demographics | Rating | Rank | Married-Couple Family Poverty |
| French | 99.7 /100 | #55 | Exceptional 4.3% |
| Immigrants | Zimbabwe | 99.7 /100 | #56 | Exceptional 4.3% |
| Immigrants | Netherlands | 99.7 /100 | #57 | Exceptional 4.3% |
| Czechoslovakians | 99.7 /100 | #58 | Exceptional 4.4% |
| Immigrants | Sweden | 99.6 /100 | #59 | Exceptional 4.4% |
| Tlingit-Haida | 99.6 /100 | #60 | Exceptional 4.4% |
| Okinawans | 99.6 /100 | #61 | Exceptional 4.4% |
| Immigrants | Australia | 99.6 /100 | #62 | Exceptional 4.4% |
| Immigrants | Sri Lanka | 99.6 /100 | #63 | Exceptional 4.4% |
| Immigrants | Bulgaria | 99.5 /100 | #64 | Exceptional 4.4% |
| Macedonians | 99.4 /100 | #65 | Exceptional 4.4% |
| Immigrants | Serbia | 99.4 /100 | #66 | Exceptional 4.4% |
| Immigrants | Canada | 99.4 /100 | #67 | Exceptional 4.4% |
| Slavs | 99.4 /100 | #68 | Exceptional 4.4% |
| New Zealanders | 99.4 /100 | #69 | Exceptional 4.4% |