Immigrants from West Indies vs Immigrants from Denmark Vision Disability
COMPARE
Immigrants from West Indies
Immigrants from Denmark
Vision Disability
Vision Disability Comparison
Immigrants from West Indies
Immigrants from Denmark
2.3%
VISION DISABILITY
0.6/ 100
METRIC RATING
244th/ 347
METRIC RANK
2.1%
VISION DISABILITY
92.9/ 100
METRIC RATING
112th/ 347
METRIC RANK
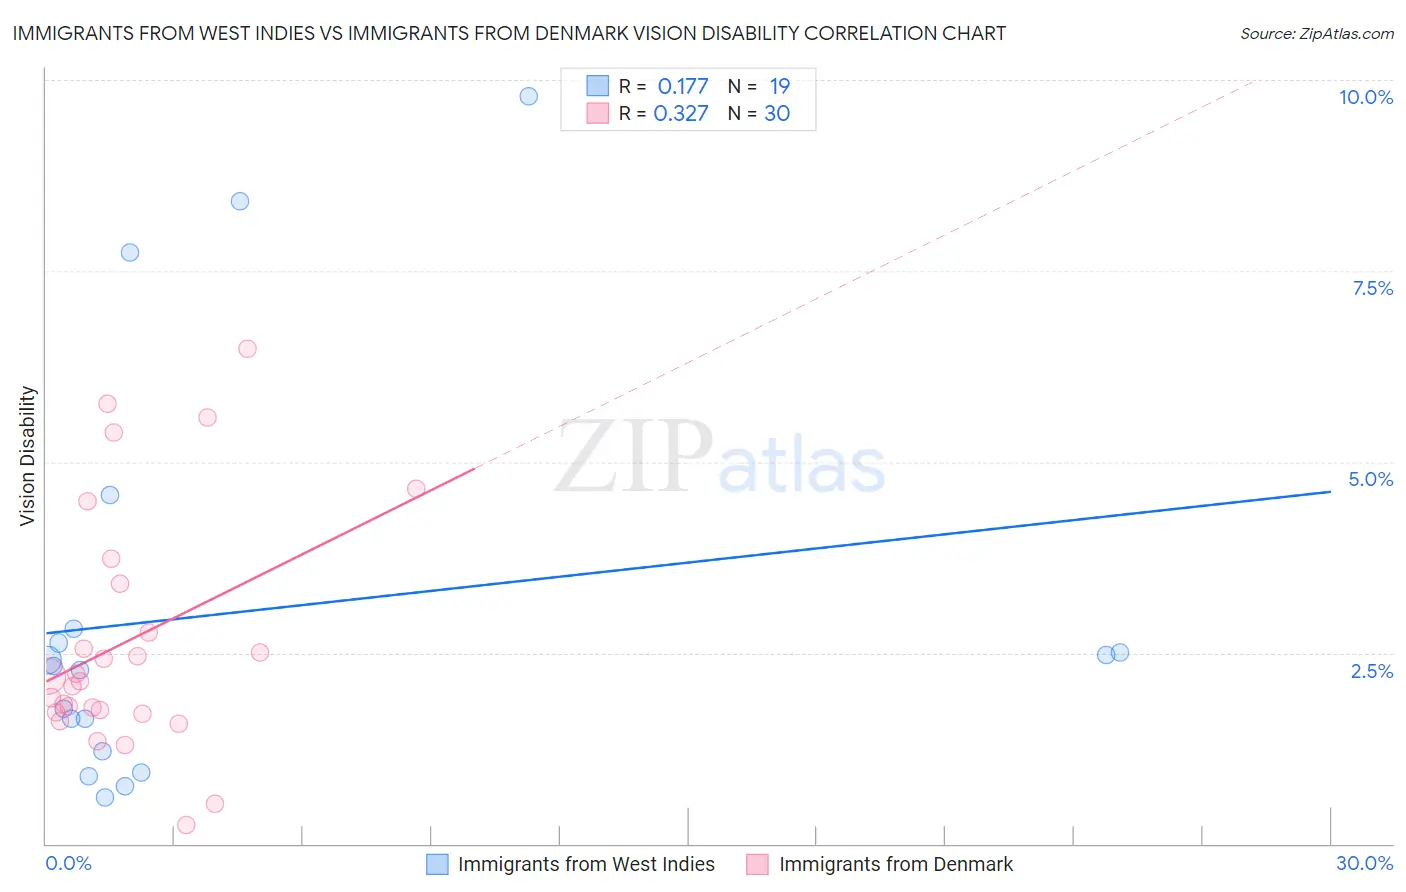
Immigrants from West Indies vs Immigrants from Denmark Vision Disability Correlation Chart
The statistical analysis conducted on geographies consisting of 72,450,769 people shows a poor positive correlation between the proportion of Immigrants from West Indies and percentage of population with vision disability in the United States with a correlation coefficient (R) of 0.177 and weighted average of 2.3%. Similarly, the statistical analysis conducted on geographies consisting of 136,398,584 people shows a mild positive correlation between the proportion of Immigrants from Denmark and percentage of population with vision disability in the United States with a correlation coefficient (R) of 0.327 and weighted average of 2.1%, a difference of 12.6%.
Vision Disability Correlation Summary
| Measurement | Immigrants from West Indies | Immigrants from Denmark |
| Minimum | 0.61% | 0.25% |
| Maximum | 9.8% | 6.5% |
| Range | 9.2% | 6.2% |
| Mean | 3.0% | 2.7% |
| Median | 2.3% | 2.2% |
| Interquartile 25% (IQ1) | 1.2% | 1.7% |
| Interquartile 75% (IQ3) | 2.8% | 3.4% |
| Interquartile Range (IQR) | 1.6% | 1.7% |
| Standard Deviation (Sample) | 2.7% | 1.6% |
| Standard Deviation (Population) | 2.6% | 1.6% |
Similar Demographics by Vision Disability
Demographics Similar to Immigrants from West Indies by Vision Disability
In terms of vision disability, the demographic groups most similar to Immigrants from West Indies are Immigrants from Nicaragua (2.3%, a difference of 0.0%), Alsatian (2.3%, a difference of 0.090%), French (2.3%, a difference of 0.24%), Guatemalan (2.3%, a difference of 0.28%), and Subsaharan African (2.3%, a difference of 0.30%).
| Demographics | Rating | Rank | Vision Disability |
| Immigrants | Portugal | 1.4 /100 | #237 | Tragic 2.3% |
| Immigrants | Cambodia | 1.1 /100 | #238 | Tragic 2.3% |
| English | 1.1 /100 | #239 | Tragic 2.3% |
| Panamanians | 0.9 /100 | #240 | Tragic 2.3% |
| Malaysians | 0.9 /100 | #241 | Tragic 2.3% |
| Immigrants | Panama | 0.8 /100 | #242 | Tragic 2.3% |
| Immigrants | Nicaragua | 0.6 /100 | #243 | Tragic 2.3% |
| Immigrants | West Indies | 0.6 /100 | #244 | Tragic 2.3% |
| Alsatians | 0.6 /100 | #245 | Tragic 2.3% |
| French | 0.5 /100 | #246 | Tragic 2.3% |
| Guatemalans | 0.5 /100 | #247 | Tragic 2.3% |
| Sub-Saharan Africans | 0.5 /100 | #248 | Tragic 2.3% |
| Liberians | 0.5 /100 | #249 | Tragic 2.3% |
| Bangladeshis | 0.5 /100 | #250 | Tragic 2.3% |
| Immigrants | Laos | 0.4 /100 | #251 | Tragic 2.4% |
Demographics Similar to Immigrants from Denmark by Vision Disability
In terms of vision disability, the demographic groups most similar to Immigrants from Denmark are Kenyan (2.1%, a difference of 0.12%), Croatian (2.1%, a difference of 0.15%), Peruvian (2.1%, a difference of 0.16%), Immigrants from Vietnam (2.1%, a difference of 0.18%), and Ugandan (2.1%, a difference of 0.18%).
| Demographics | Rating | Rank | Vision Disability |
| Carpatho Rusyns | 94.3 /100 | #105 | Exceptional 2.1% |
| Swedes | 94.2 /100 | #106 | Exceptional 2.1% |
| Danes | 94.2 /100 | #107 | Exceptional 2.1% |
| Koreans | 94.1 /100 | #108 | Exceptional 2.1% |
| Chileans | 94.0 /100 | #109 | Exceptional 2.1% |
| Immigrants | Armenia | 93.8 /100 | #110 | Exceptional 2.1% |
| Peruvians | 93.5 /100 | #111 | Exceptional 2.1% |
| Immigrants | Denmark | 92.9 /100 | #112 | Exceptional 2.1% |
| Kenyans | 92.5 /100 | #113 | Exceptional 2.1% |
| Croatians | 92.3 /100 | #114 | Exceptional 2.1% |
| Immigrants | Vietnam | 92.2 /100 | #115 | Exceptional 2.1% |
| Ugandans | 92.2 /100 | #116 | Exceptional 2.1% |
| Poles | 92.0 /100 | #117 | Exceptional 2.1% |
| Immigrants | Philippines | 91.4 /100 | #118 | Exceptional 2.1% |
| Immigrants | Uganda | 91.4 /100 | #119 | Exceptional 2.1% |