Immigrants from Armenia vs Salvadoran Married-Couple Family Poverty
COMPARE
Immigrants from Armenia
Salvadoran
Married-Couple Family Poverty
Married-Couple Family Poverty Comparison
Immigrants from Armenia
Salvadorans
7.1%
MARRIED-COUPLE FAMILY POVERTY
0.0/ 100
METRIC RATING
312th/ 347
METRIC RANK
6.5%
MARRIED-COUPLE FAMILY POVERTY
0.0/ 100
METRIC RATING
288th/ 347
METRIC RANK
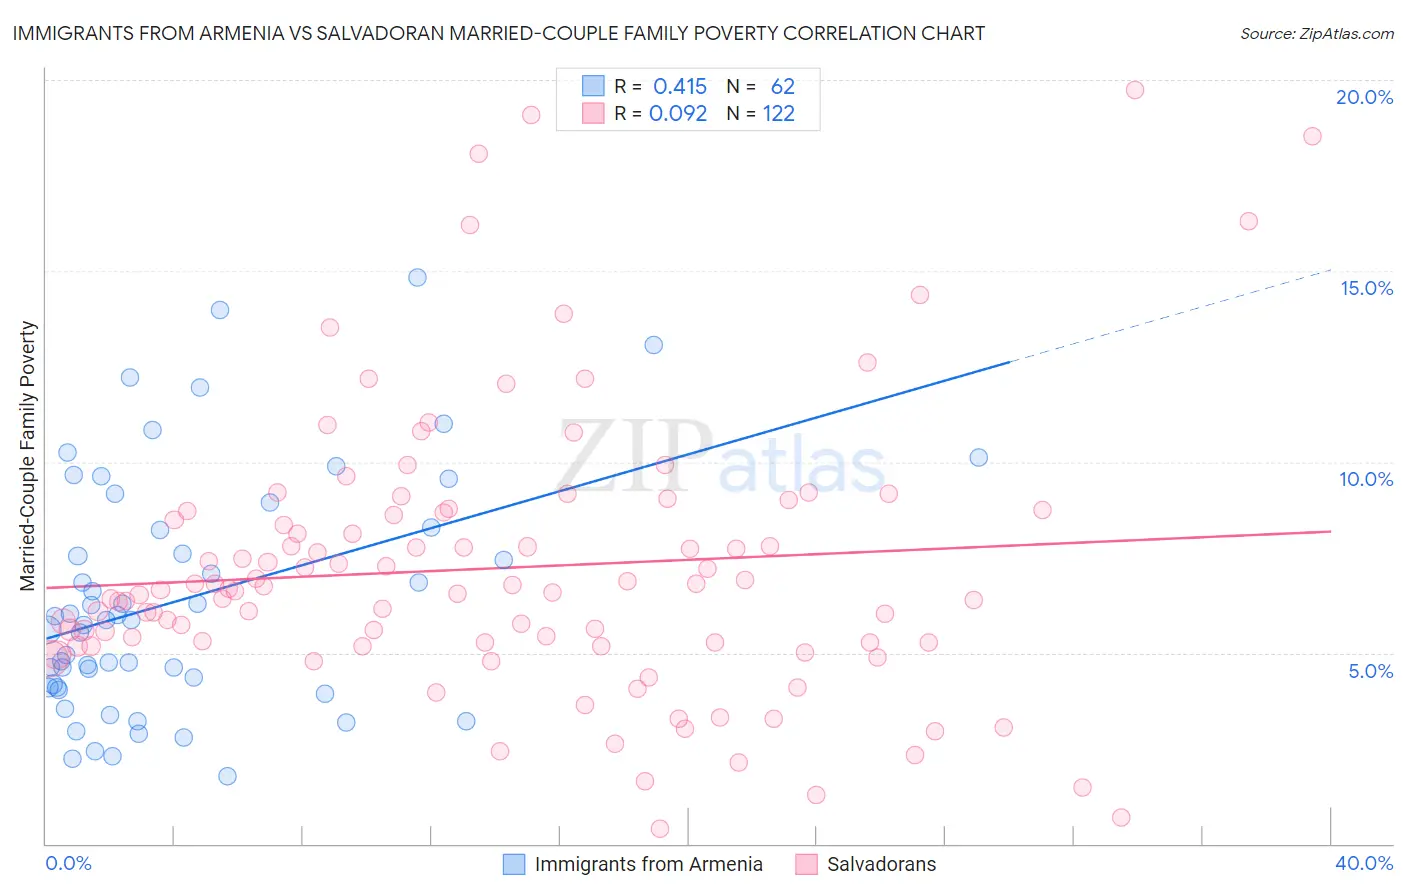
Immigrants from Armenia vs Salvadoran Married-Couple Family Poverty Correlation Chart
The statistical analysis conducted on geographies consisting of 97,477,014 people shows a moderate positive correlation between the proportion of Immigrants from Armenia and poverty level among married-couple families in the United States with a correlation coefficient (R) of 0.415 and weighted average of 7.1%. Similarly, the statistical analysis conducted on geographies consisting of 395,885,602 people shows a slight positive correlation between the proportion of Salvadorans and poverty level among married-couple families in the United States with a correlation coefficient (R) of 0.092 and weighted average of 6.5%, a difference of 8.8%.
Married-Couple Family Poverty Correlation Summary
| Measurement | Immigrants from Armenia | Salvadoran |
| Minimum | 1.8% | 0.40% |
| Maximum | 14.8% | 19.7% |
| Range | 13.1% | 19.3% |
| Mean | 6.4% | 7.2% |
| Median | 5.9% | 6.6% |
| Interquartile 25% (IQ1) | 4.1% | 5.3% |
| Interquartile 75% (IQ3) | 8.3% | 8.7% |
| Interquartile Range (IQR) | 4.2% | 3.4% |
| Standard Deviation (Sample) | 3.1% | 3.6% |
| Standard Deviation (Population) | 3.1% | 3.6% |
Similar Demographics by Married-Couple Family Poverty
Demographics Similar to Immigrants from Armenia by Married-Couple Family Poverty
In terms of married-couple family poverty, the demographic groups most similar to Immigrants from Armenia are Immigrants from Dominica (7.1%, a difference of 0.0%), Immigrants from Nicaragua (7.1%, a difference of 0.050%), Hopi (7.1%, a difference of 0.080%), Immigrants from St. Vincent and the Grenadines (7.1%, a difference of 0.11%), and British West Indian (7.1%, a difference of 0.41%).
| Demographics | Rating | Rank | Married-Couple Family Poverty |
| Haitians | 0.0 /100 | #305 | Tragic 6.8% |
| Immigrants | Haiti | 0.0 /100 | #306 | Tragic 7.0% |
| Guatemalans | 0.0 /100 | #307 | Tragic 7.0% |
| Spanish American Indians | 0.0 /100 | #308 | Tragic 7.1% |
| Hopi | 0.0 /100 | #309 | Tragic 7.1% |
| Immigrants | Nicaragua | 0.0 /100 | #310 | Tragic 7.1% |
| Immigrants | Dominica | 0.0 /100 | #311 | Tragic 7.1% |
| Immigrants | Armenia | 0.0 /100 | #312 | Tragic 7.1% |
| Immigrants | St. Vincent and the Grenadines | 0.0 /100 | #313 | Tragic 7.1% |
| British West Indians | 0.0 /100 | #314 | Tragic 7.1% |
| Inupiat | 0.0 /100 | #315 | Tragic 7.1% |
| Hondurans | 0.0 /100 | #316 | Tragic 7.2% |
| Mexicans | 0.0 /100 | #317 | Tragic 7.2% |
| Immigrants | Guatemala | 0.0 /100 | #318 | Tragic 7.2% |
| Immigrants | Latin America | 0.0 /100 | #319 | Tragic 7.2% |
Demographics Similar to Salvadorans by Married-Couple Family Poverty
In terms of married-couple family poverty, the demographic groups most similar to Salvadorans are Nepalese (6.5%, a difference of 0.17%), Ecuadorian (6.5%, a difference of 0.19%), Immigrants from Barbados (6.5%, a difference of 0.40%), Belizean (6.5%, a difference of 0.44%), and Guyanese (6.5%, a difference of 0.56%).
| Demographics | Rating | Rank | Married-Couple Family Poverty |
| Mexican American Indians | 0.0 /100 | #281 | Tragic 6.4% |
| Seminole | 0.0 /100 | #282 | Tragic 6.4% |
| Ute | 0.0 /100 | #283 | Tragic 6.4% |
| Dutch West Indians | 0.0 /100 | #284 | Tragic 6.4% |
| Blacks/African Americans | 0.0 /100 | #285 | Tragic 6.5% |
| Guyanese | 0.0 /100 | #286 | Tragic 6.5% |
| Ecuadorians | 0.0 /100 | #287 | Tragic 6.5% |
| Salvadorans | 0.0 /100 | #288 | Tragic 6.5% |
| Nepalese | 0.0 /100 | #289 | Tragic 6.5% |
| Immigrants | Barbados | 0.0 /100 | #290 | Tragic 6.5% |
| Belizeans | 0.0 /100 | #291 | Tragic 6.5% |
| Immigrants | Lebanon | 0.0 /100 | #292 | Tragic 6.6% |
| Arapaho | 0.0 /100 | #293 | Tragic 6.6% |
| Bahamians | 0.0 /100 | #294 | Tragic 6.6% |
| Immigrants | Uzbekistan | 0.0 /100 | #295 | Tragic 6.6% |